The man responsible for the MLB postseason odds

As you've followed the pennant races this year, you've probably noticed those "DIV," "WC," and "POFF" columns that have been added to ESPN.com's MLB standings. They refer to the odds of a given team winning its division, winning the wild card, and making the postseason, respectively.
Those numbers come from an operation called coolstandings.com, which generates the probabilities by simulating the regular season one million times every single day (for more on how they do this, look here and here). The numbers are also a regular source of confusion for any fan wondering how, for example, the Rockies could have been given only a 7.1 percent chance of making the playoffs on Sept. 14 last year and then ended up in the World Series.
The answer, of course, is that the Rockies won 14 of their last 15 games, and no predictive model could have anticipated that. "But that's exactly the point," some of you are probably thinking. "Baseball has so many intangibles, there's no way you can predict the odds."

Greg Agami
Here's Greg Agami, the CEO of coolstandings.com.
Or is there? Like most baseball fans, I have an instinctive distrust of putting computer predictions ahead of gut reactions and common sense (plus I live and die with a team whose recent late-season follies have defied all sorts of odds). But I also love numbers and statistics. So when I look at the coolstandings.com probabilities, part of me is intrigued and part of me just wants to say, "Yo, I don't need a computer to tell me the Royals and Pirates are gonna suck again, OK?"
Many of you probably feel a similar inner conflict. So in an attempt to suss out the story behind the numbers, I had a chat on Wednesday with coolstandings.com CEO Greg Agami. Here's how it went down:
Page 2: Obviously, the average baseball fan is not a mathematician. Do fans tend to misunderstand what odds and probability statistics really mean? And if so, could you give us a little primer or tutorial?
Greg Agami: Sure. A lot of times fans will look at the numbers we throw out and take it the wrong way. Like if we say a team has a 60 percent chance of making the playoffs, we'll get a lot of e-mails saying, "What are you talking about? There's no way this team is going to make the playoffs!" And people need to remember that when we say 60 percent, that means there's still a 40 percent chance that they're not going to make the playoffs. Fans have a tendency to either round up or round down.
P2: Well, yeah, but 60 percent is a better-than-even chance.
GA: Right. And that's really what we're trying to do, to find out the most likely situations at the end of the year. A lot of fans do enjoy the numbers -- it's basically another cool stat for people to track. And lots of fans do understand the numbers. There have even been situations where fans have pointed things out that we hadn't thought of.
P2: Can you give me an example?
GA: Originally we didn't take hot streaks into account. When fans brought that to our attention, we started emphasizing recent scores as opposed to older scores.
P2: Because the way a team is performing most recently is a better predictive indicator than how they were performing a few months ago?
GA: Exactly. Another thing is that we originally didn't factor tiebreaker scenarios into our numbers. But we got a lot of angry e-mails about that, and now we factor that in. The fans definitely keep us honest -- if something doesn't make sense, they let us know.
P2: I think a lot of people are confused and frustrated by probability stats, and not just in sports. On the one hand, they hear terms like a "100-year flood," but then that type of flood seems to happen every seven or eight years. Similarly, it seems like every sports season features some streak or collapse that defies any rational sense of prediction, like last year, when the Mets folded and the Rockies went on that incredible run. In my lifetime, just off the top of my head, I've seen the Yankees come back from 14½ games out; I've seen the Red Sox come back in a playoff series after being down three games to none; I've seen the Tigers start the season 35-5, and on and on. Doesn't history teach us that there are always unexplainable streaks like that, which are impossible to predict?
GA: I think a lot of people jump on the historical bandwagon and say, "This is a historic collapse," because they like thinking that they're witnessing history. That's one part of it. Talking about the Mets and the Rockies last year, that kind of thing doesn't happen every season. When we were looking at the Mets, they were over a 99 percent chance of making the playoffs [when they had a seven-game lead with 17 games left to play]. That means 99 percent of the teams in that situation will make the playoffs. And the Rockies were about a 2 percent or 3 percent chance to make the playoffs before they got hot.
P2: You're saying those are essentially once-in-a-lifetime situations, but what I'm saying is that it seems like a situation like that comes along every season. Am I wrong? Is it just that those streaks and collapses stick out in my mind because they're so remarkable? Seriously, doesn't something weird like that happen almost every year?
GA: The thing you have to remember with a case like the Rockies, when we say they had a 2 percent chance, which is basically a 1-in-50 shot, that doesn't mean it's going to happen once every 50 years. It means for every 50 teams that find themselves in that situation -- a certain number of games back with a certain number left to play, with the schedule they were facing -- one of them will make the playoffs. And there are a lot of teams in that situation, and most of them don't make the playoffs. Half the league was probably in that situation last year.
P2: So you're saying for every 2007 Rockies, there's, say, a 2008 Blue Jays, who were in fourth place, 10 games out or whatever, and nobody thinks about them because they just did what teams routinely do when they're that many games out in early September, which is to play out the string and not make the postseason?
GA: Exactly.
P2: In football, the best team on the field usually wins. But in baseball, as we're always taught, even the best team loses 60 games and even the worst team wins 60 games. Doesn't that make it hard to predict baseball outcomes?
GA: A little bit. But the thing that makes baseball easier is that you have so many more games over a long season. In football, you only have 16 games, so you don't have as much data to make accurate predictions -- you have to make a lot of assumptions. But for baseball, where you've got 162 games, even if the best team doesn't win an individual game, the best team usually emerges over the long haul.
P2: I'm a Mets fan, so let's look at the National League East. On Sept. 10, the Mets had a 3½-game lead and you made them an 88 percent lock to win the division. After the games of Sept. 23, less than two weeks later, they had sunk to a game and a half behind, with only a 15 percent chance of winning the division. How can a predictive model swing so wildly in the space of 13 days?
GA: We got a lot of e-mail from angry Mets fans. …
P2: Oh, I'm not angry. I mean, I'm angry at Aaron Heilman and Scott Schoeneweis, but not at you. I'm just saying that in the space of 13 days, they went from having an 88 percent chance to win to a 15 percent chance. I realize that correlates to their performance on the field, which hasn't been good, but doesn't that seem like an odd way for a predictive model to behave?
GA: It does. We do have what we call our "Sanity Check" -- when we see swings like that, we check our "dumb model" [which assumes each team has a 50 percent chance to win any given game, regardless of the teams' relative talent levels] against our "smart model" [which accounts for past performance, strength of schedule, etc.]. And even there, you do see wild swings, especially late in the season, when every game can have such a big impact. I mean, a team can have a 50 percent chance of making the playoffs going into the last game of the season, but if they lose that game it goes down to zero, so you can have a 50 percent swing just in one game.
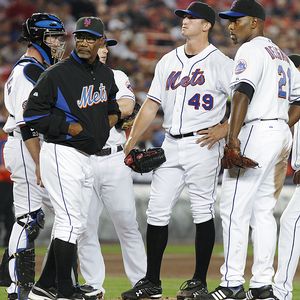
AP Photo/Kathy Willens
Things are looking even more dire for the Mets after Wednesday night's collapse against the Cubs.
P2: Well, yeah, but that's a unique situation. Anyway, in the case of the Mets, the reason the numbers shifted so much, obviously, is that the model didn't predict the Mets to lose five games in the standings in 13 days, yet it happened. Does this call the model's methodology into question? Or to put it another way, I mentioned to a friend of mine that I was going to be interviewing you, and he said, "Ask him this: If your odds are accurate, how come so many teams overcome them on such a regular basis?" Is that a fair question?
GA: It's a very fair question. When we see the Mets doing this two years in a row, you have to wonder. But again, you never hear anything about all the teams that are essentially doing what's expected. And that goes back to our historical model -- when we look at all the teams that were given an 80 percent or 90 percent chance of making the playoffs after being in a given situation, it turns out that between 80 percent and 90 percent of them did in fact make the playoffs. Anecdotally, it may seem like a lot of teams have overcome the odds. But that's because you don't notice all the teams that don't overcome the odds and simply do what they're expected to do.
P2: Here's something else I'm confused by: Going into Tuesday's games [Sept. 23], the Phillies had a two-game lead in the loss column with six games to play. Now, a two-game lead in the loss column with six left to play is a pretty nice position to be in, but it's hardly airtight, especially since the Mets have the tiebreaker over the Phils based on head-to-head matchups -- assuming the Mets and Phils both finish ahead of the Brewers. Yet on that day you listed the Phillies as a 95 percent lock to win the division. Those are 19-1 odds, based on two games in the loss column. Doesn't that seem like a bit much?
GA: It does, but when you go through the math, and take a look at all the possible scenarios in which the Mets could catch the Phillies -- like, for example, the Mets going 5-1 while the Phillies go 2-3 -- there's only a 5 percent chance of one of those scenarios taking place.
P2: Yeah, but then on Tuesday night, the Mets won and the Phils lost. So now the Phillies are ahead by just one game in the loss column, which just seems to reinforce the volatility of the situation. And again, the Mets still hold the tiebreaker. Yet you still list the Phils as 84 percent likely to win the division. I mean, c'mon, man -- 84 percent, based on a one-game lead in the loss column? That doesn't seem out of whack to you? I'm not saying that as an angry Mets fan -- I'm just saying I can't wrap my head around that number. I mean, a one-game lead with one game left to play doesn't seem all that safe to me, much less with five left to play.
GA: Yeah. Well, that's the type of thing you get sometimes. Since the Mets have been struggling of late, that's the kind of thing that's taken into account, so that's part of it.
P2: OK. But can you understand that in the context of, y'know, two guys sitting around and talking over a couple of beers, it sounds pretty counterintuitive that a one-game lead in the loss column with five games left to play could translate to an 84 percent probability?
GA: I totally agree. [After this interview, Agami sent a follow-up note: "I took a closer look at the Mets-Phillies situation, and found that our 'dumb' model gives the Mets a 24.1 percent chance of winning the division, as opposed to the 15.3 percent chance that our 'smart' model reflects. The main reasons for the smart model downgrading the Mets' chances are that (1) the Phillies play Atlanta and Washington, who have a combined .393 winning percentage, while the Mets play the Cubs and Marlins, who have a combined .553 winning percentage, and (2) the Phillies have been hotter than the Mets recently, with the Phillies going 14-6 in September and the Mets going 10-9. Also, both teams have all home games remaining, and the Phillies have a higher run differential at home (+70) than the Mets (+47)." For a more involved look at all this, click here.]
P2: Similarly, the Mets have a one-game lead on the Brewers for the wild-card slot, yet the Mets are given a comparatively paltry 57 percent chance of winning the wild card. Why is the Phillies' one-game lead over the Mets worth nearly 30 percentage points of probability more than the Mets' one-game lead over the Brewers? And I realize they have different schedules and so on, but still -- 30 percentage points of difference, based on similar leads over their nearest rivals?
GA: Part of that is that the Mets still have a shot at winning their division. So when you see their 57 percent chance to win the wild card, part of the other 43 percent is that they could fail to win the wild card by winning their division.
P2: Ah, got it. I see. Hey, as we talk about this, another question occurs to me: Are probability statistics less meaningful late in the season, when a single rogue element like an injury, or a batter who suddenly gets hot, or whatever, can have a disproportionate effect on the remaining schedule?
GA: It can, yeah. We don't normally take trades or injuries into account, because the thinking is that those factors get smoothed out over time.
P2: Right, but what I'm saying is that now there's very little time left.
GA: Yes, that's very accurate. Near the end of the season, our "smart" and "dumb" models start to converge a bit. Also, at the end of the season, we can't account for things like the Cubs' resting their regulars or being less motivated now that they've clinched.
P2: Similarly, I assume you can't account for things like the Mets being really tight because they collapsed last year and are terrified of doing it again, right? Or other intangibles like the media picking a fight with a particular manager, or the fact that managers manage differently in a September pennant race than they do in July, or whatever.
GA: Right.
P2: Would you agree that those factors do affect the outcomes of games?
GA: I would definitely agree. Over the long term, it's probably less of a factor, but I would agree that there are all sorts of intangibles. I'm a Red Sox fan, and I've seen a lot of those late-season collapses where you can just feel that they're playing tight and it all just snowballs. That's part of the reason we put more emphasis on recent scores, to try to capture the team's momentum at a given moment.
P2: I realize you can't account for specific intangibles. But can you put in a "Go figure!" element, sort of an assumption that something weird and unanticipated is going to happen, kind of a like a random number generator? Basically, can you have a built-in prediction that something unpredictable will happen?
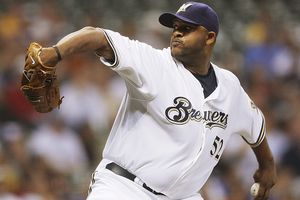
AP Photo/Morry Gash
Seems like the Brewers are going to keep pitching CC Sabathia until his arm falls off, in their attempt to make the postseason.
GA: We actually do just that. If you have a team that's playing .550 ball, it might actually be a .600 team that's underachieving, or a .500 team that's overachieving. So after we estimate how many runs a team will score against its opponents, we add in a random error in either direction. So in each of the million simulations we do, that team will be a slightly different team -- sometimes a little bit better, sometimes a little bit worse. And that's a way of trying to capture why a team's performance isn't quite what its stats are saying it should be.
P2: Are you a betting man?
GA: Actually, no.
P2: Why not?
GA: When we do our playoff projections, I already feel like I've got money on the game.
P2: You mean you're essentially betting your professional reputation?
GA: Exactly! If our simulations project that the Red Sox will lose a playoff series, I'm really torn -- I want them to win, but I feel like I've put money down against them. I'm always glad when the simulation predicts wins for the teams I'd be rooting for anyway. But as for betting, we know some people are going to use the numbers for that purpose, but we try to stay away from that. We don't give spreads or anything like that.
P2: If you were a bettor, would you be comfortable betting on the basis of coolstandings' probability stats?
GA: From an engineering point of view?
P2: From the point of view of being the most successful bettor you could be, and winning the most money.
GA: Yeah, I would definitely take it into account. It's highly objective data based on a historical model going back 100 years.
P2: You'd only "take it into account"? You wouldn't use it as your exclusive basis of betting?
GA: Well, there are also those intangibles you mentioned. There are some things the simulation doesn't take into account, like the starting pitchers for a particular series. Things like that. Those would be a factor, especially in the short term. But over the long term, since the computer isn't biased or emotional, it's very useful.
Paul Lukas is a columnist for Page 2. He'll be attending Thursday's Mets-Cubs game, where he computes that the probability of rain is significantly higher than the probability of Pedro Martinez getting out of the fourth inning.
Comments
You must be signed in to post a comment