
Memphis Grizzlies @ Boston Celtics

16-48, 4-27 Away
92
16-48, 4-27 Away

50-16, 27-6 Home
102
50-16, 27-6 Home
Game Leaders


Team Stats


42% (33-78)
Field Goal %
50% (38-76)
44% (7-16)
Three Point %
32% (7-22)
79% (19-24)
Free Throw %
83% (19-23)
34
Turnovers
26
47
Rebounds
45
9
Largest Lead
17
Game Information
Boston, MA
Referee:Bob Delaney
Referee:Jim Clark
Referee:Jack Nies
Team Stats
 | | |
|---|---|---|
| FG | 33-78 | 38-76 |
| Field Goal % | 42 | 50 |
| 3PT | 7-16 | 7-22 |
| Three Point % | 44 | 32 |
| FT | 19-24 | 19-23 |
| Free Throw % | 79 | 83 |
| Rebounds | 47 | 45 |
| Offensive Rebounds | 13 | 12 |
| Defensive Rebounds | 26 | 29 |
| Assists | 21 | 26 |
| Steals | 6 | 8 |
| Blocks | 4 | 7 |
| Total Turnovers | 34 | 26 |
| Points Conceded Off Turnovers | 13 | 27 |
| Fast Break Points | 7 | 5 |
| Points in Paint | 30 | 48 |
| Fouls | 17 | 23 |
| Technical Fouls | 1 | 2 |
| Flagrant Fouls | 0 | 0 |
| Largest Lead | 9 | 17 |
Matchups
2025-26 Standings
Western Conference
| Southwest | W | L | PCT | GB | STRK |
|---|---|---|---|---|---|
| San Antonio | 43 | 16 | .729 | - | W11 |
| Houston | 37 | 21 | .638 | 5.5 | W3 |
| Memphis | 22 | 36 | .379 | 20.5 | W1 |
| Dallas | 21 | 38 | .356 | 22 | L2 |
| New Orleans | 18 | 42 | .300 | 25.5 | W3 |
Eastern Conference
| Atlantic | W | L | PCT | GB | STRK |
|---|---|---|---|---|---|
| Boston | 39 | 20 | .661 | - | W1 |
| New York | 38 | 22 | .633 | 1.5 | W1 |
| Toronto | 34 | 25 | .576 | 5 | L2 |
| Philadelphia | 33 | 26 | .559 | 6 | W3 |
| Brooklyn | 15 | 44 | .254 | 24 | L7 |
NBA News

Mavericks waiving Tyus Jones, signing Ryan Nembhard to 2-year deal
The Dallas Mavericks are waiving veteran Tyus Jones and signing two-way guard Ryan Nembhard to a new two-year contract, Todd Ramasar and Jaafar Choufani of Life Sports Agency told ESPN.
5h
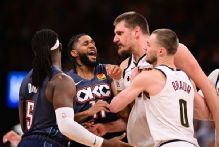
Nuggets' Jokic calls out Thunder's Dort for 'unnecessary' foul
Thunder guard Lu Dort was called for a flagrant foul 2 and ejected from Friday night's game after appearing to trip Nuggets star Nikola Jokic, who called the play "an unnecessary move."
8h

Pacers face the Grizzlies on 5-game slide
Memphis Grizzlies (22-36, 11th in the Western Conference) vs. Indiana Pacers (15-45, 15th in the Eastern Conference)
14h