
Minnesota Timberwolves @ Philadelphia 76ers

13-39, 4-22 Away
97
13-39, 4-22 Away
Final
| 1 | 2 | 3 | 4 | T | |
|---|---|---|---|---|---|
MIN | 23 | 28 | 25 | 21 | 97 |
PHI | 30 | 43 | 24 | 22 | 119 |

20-31, 9-16 Home
119
20-31, 9-16 Home
Game Leaders


Team Stats


47% (36-76)
Field Goal %
57% (46-80)
40% (6-15)
Three Point %
36% (5-14)
73% (19-26)
Free Throw %
88% (22-25)
38
Turnovers
32
41
Rebounds
43
0
Largest Lead
27
Game Information
Philadelphia, PA

Referee:Sean Corbin
Referee:Greg Willard
Referee:Marat Kogut
Team Stats
 | | |
|---|---|---|
| FG | 36-76 | 46-80 |
| Field Goal % | 47 | 57 |
| 3PT | 6-15 | 5-14 |
| Three Point % | 40 | 36 |
| FT | 19-26 | 22-25 |
| Free Throw % | 73 | 88 |
| Rebounds | 41 | 43 |
| Offensive Rebounds | 7 | 8 |
| Defensive Rebounds | 25 | 31 |
| Assists | 21 | 30 |
| Steals | 9 | 13 |
| Blocks | 0 | 2 |
| Total Turnovers | 38 | 32 |
| Points Conceded Off Turnovers | 9 | 31 |
| Fast Break Points | 14 | 26 |
| Points in Paint | 34 | 58 |
| Fouls | 17 | 22 |
| Technical Fouls | 0 | 0 |
| Flagrant Fouls | 0 | 0 |
| Largest Lead | 0 | 27 |
Matchups
2025-26 Standings
Western Conference
| Northwest | W | L | PCT | GB | STRK |
|---|---|---|---|---|---|
| Oklahoma City | 46 | 15 | .754 | - | W1 |
| Denver | 37 | 23 | .617 | 8.5 | L1 |
| Minnesota | 37 | 23 | .617 | 8.5 | W2 |
| Portland | 29 | 32 | .475 | 17 | L1 |
| Utah | 18 | 42 | .300 | 27.5 | L5 |
Eastern Conference
| Atlantic | W | L | PCT | GB | STRK |
|---|---|---|---|---|---|
| Boston | 39 | 20 | .661 | - | W1 |
| New York | 38 | 22 | .633 | 1.5 | W1 |
| Toronto | 35 | 25 | .583 | 4.5 | W1 |
| Philadelphia | 33 | 26 | .559 | 6 | W3 |
| Brooklyn | 15 | 44 | .254 | 24 | L7 |
NBA News
Shaq rides around on a scooter on 'Inside the NBA'
Shaq takes a cruise around the "Inside the NBA" set on a scooter.
37m
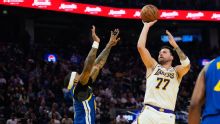
Los Angeles Lakers vs. Golden State Warriors: Game Highlights
Los Angeles Lakers vs. Golden State Warriors: Game Highlights
1h
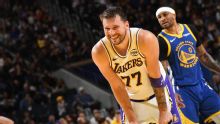
Luka Doncic scores 26 points, LeBron James adds 22 as Lakers run away from Warriors for 129-101 win
— Luka Doncic had 26 points, eight assists and six rebounds, LeBron James added 22 points, nine assists and seven rebounds, and the Los Angeles Lakers ran away from the short-handed Golden State Warriors for a 129-101 win Saturday night.
35m