
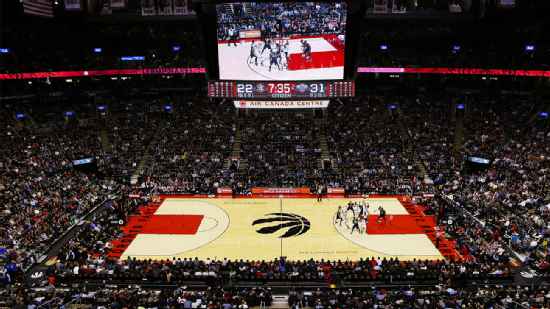
Washington Wizards @ Toronto Raptors

19-34, 8-18 Away
104
19-34, 8-18 Away

31-24, 21-7 Home
109
31-24, 21-7 Home
Game Leaders


Team Stats


47% (43-91)
Field Goal %
52% (38-73)
43% (6-14)
Three Point %
54% (7-13)
67% (12-18)
Free Throw %
81% (26-32)
28
Turnovers
28
51
Rebounds
44
10
Largest Lead
10
Game Information
Toronto, ON
Referee:Monty McCutchen
Referee:James Capers
Referee:Olandis Poole
Team Stats
 | | |
|---|---|---|
| FG | 43-91 | 38-73 |
| Field Goal % | 47 | 52 |
| 3PT | 6-14 | 7-13 |
| Three Point % | 43 | 54 |
| FT | 12-18 | 26-32 |
| Free Throw % | 67 | 81 |
| Rebounds | 51 | 44 |
| Offensive Rebounds | 16 | 14 |
| Defensive Rebounds | 18 | 24 |
| Assists | 20 | 21 |
| Steals | 4 | 4 |
| Blocks | 4 | 7 |
| Total Turnovers | 28 | 28 |
| Points Conceded Off Turnovers | 17 | 21 |
| Fast Break Points | 20 | 11 |
| Points in Paint | 40 | 44 |
| Fouls | 26 | 19 |
| Technical Fouls | 0 | 1 |
| Flagrant Fouls | 0 | 0 |
| Largest Lead | 10 | 10 |
Matchups
2025-26 Standings
Eastern Conference
| Southeast | W | L | PCT | GB | STRK |
|---|---|---|---|---|---|
| Orlando | 31 | 27 | .534 | - | L1 |
| Miami | 32 | 29 | .525 | 0.5 | W1 |
| Charlotte | 30 | 31 | .492 | 2.5 | W4 |
| Atlanta | 30 | 31 | .492 | 2.5 | W3 |
| Washington | 16 | 43 | .271 | 15.5 | L4 |
| Atlantic | W | L | PCT | GB | STRK |
|---|---|---|---|---|---|
| Boston | 39 | 20 | .661 | - | W1 |
| New York | 39 | 22 | .639 | 1 | W2 |
| Toronto | 35 | 25 | .583 | 4.5 | W1 |
| Philadelphia | 33 | 26 | .559 | 6 | W3 |
| Brooklyn | 15 | 44 | .254 | 24 | L7 |
NBA News
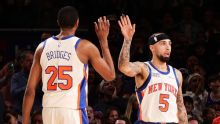
Knicks snap Spurs' 11-game winning streak
The Knicks get a balanced scoring attack and take down the Spurs to snap San Antonio's 11-game win streak.
4h
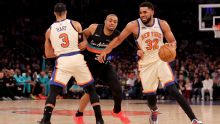
Knicks snap the Spurs' 11-game winning streak with a 114-89 victory
— Mikal Bridges had 25 points, Jalen Brunson scored 24 and the New York Knicks snapped the San Antonio Spurs' 11-game winning streak with a 114-89 victory on Sunday.
4h

Lakers' win caps Zhuri and LeBron James' father-daughter road trip
LeBron James' latest achievement in his 23-year career? A successful father-daughter road trip.
6h