
Sacramento Kings @ LA Clippers

4-10, 2-4 Away
82
4-10, 2-4 Away

3-13, 3-6 Home
100
3-13, 3-6 Home
Game Leaders


Team Stats


41% (29-71)
Field Goal %
51% (35-69)
36% (4-11)
Three Point %
15% (2-13)
63% (20-32)
Free Throw %
78% (28-36)
26
Turnovers
34
43
Rebounds
53
7
Largest Lead
20
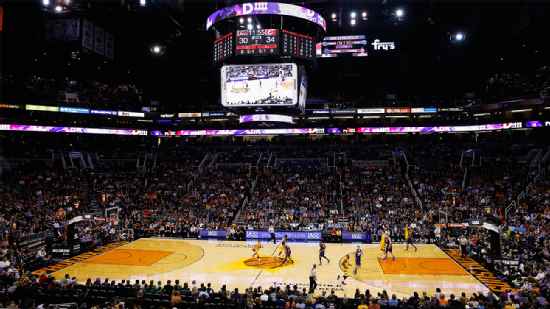
Game Information
Phoenix, AZ
Team Stats
 | | |
|---|---|---|
| FG | 29-71 | 35-69 |
| Field Goal % | 41 | 51 |
| 3PT | 4-11 | 2-13 |
| Three Point % | 36 | 15 |
| FT | 20-32 | 28-36 |
| Free Throw % | 63 | 78 |
| Rebounds | 43 | 53 |
| Offensive Rebounds | 9 | 10 |
| Defensive Rebounds | 26 | 35 |
| Assists | 21 | 19 |
| Steals | 7 | 5 |
| Blocks | 4 | 4 |
| Total Turnovers | 26 | 34 |
| Points Conceded Off Turnovers | 16 | 17 |
| Fast Break Points | 11 | 7 |
| Points in Paint | 32 | 58 |
| Fouls | 26 | 25 |
| Technical Fouls | 1 | 1 |
| Flagrant Fouls | 0 | 0 |
| Largest Lead | 7 | 20 |
Matchups
2025-26 Standings
Western Conference
| Pacific | W | L | PCT | GB | STRK |
|---|---|---|---|---|---|
| LA Lakers | 32 | 20 | .615 | - | L1 |
| Phoenix | 31 | 22 | .585 | 1.5 | L2 |
| Golden State | 29 | 25 | .537 | 4 | W1 |
| LA Clippers | 25 | 27 | .481 | 7 | W2 |
| Sacramento | 12 | 43 | .218 | 21.5 | L13 |
NBA News

Why Stephen A. could see Jayson Tatum's return hurting Celtics
Stephen A. Smith urges Jayson Tatum to not rush back from injury as he weighs in on what Tatum's return could mean for Boston.
3h

Stephen A. rips JJ Redick and the Lakers' defense
Stephen A. Smith explains why the Lakers' defense is holding the team back from being contenders.
3h

Why Stephen A. 'didn't mind' Pistons-Hornets brawl
Stephen A. Smith explains why he doesn't have much of an issue with the brawl between the Pistons and the Hornets that saw four players ejected.
4h