
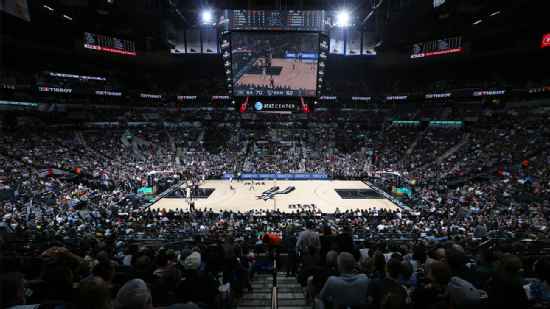
Oklahoma City Thunder @ San Antonio Spurs

23-12, 10-6 Away
74
23-12, 10-6 Away

29-4, 19-2 Home
101
29-4, 19-2 Home
Game Leaders


Team Stats


33% (28-85)
Field Goal %
47% (42-90)
14% (1-7)
Three Point %
31% (5-16)
71% (17-24)
Free Throw %
75% (12-16)
38
Turnovers
28
58
Rebounds
58
0
Largest Lead
27
Game Information
San Antonio, TX
Referee:Joe Crawford
Referee:Tony Brown
Referee:Eric Dalen
Team Stats
 | | |
|---|---|---|
| FG | 28-85 | 42-90 |
| Field Goal % | 33 | 47 |
| 3PT | 1-7 | 5-16 |
| Three Point % | 14 | 31 |
| FT | 17-24 | 12-16 |
| Free Throw % | 71 | 75 |
| Rebounds | 58 | 58 |
| Offensive Rebounds | 14 | 11 |
| Defensive Rebounds | 36 | 41 |
| Assists | 10 | 23 |
| Steals | 7 | 10 |
| Blocks | 7 | 5 |
| Total Turnovers | 38 | 28 |
| Points Conceded Off Turnovers | 5 | 17 |
| Fast Break Points | 12 | 24 |
| Points in Paint | 26 | 60 |
| Fouls | 17 | 20 |
| Technical Fouls | 0 | 1 |
| Flagrant Fouls | 0 | 0 |
| Largest Lead | 0 | 27 |
Matchups
2025-26 Standings
Western Conference
| Northwest | W | L | PCT | GB | STRK |
|---|---|---|---|---|---|
| Oklahoma City | 60 | 16 | .789 | - | W3 |
| Denver | 48 | 28 | .632 | 12 | W6 |
| Minnesota | 46 | 29 | .613 | 13.5 | W1 |
| Portland | 38 | 38 | .500 | 22 | W1 |
| Utah | 21 | 55 | .276 | 39 | L6 |
| Southwest | W | L | PCT | GB | STRK |
|---|---|---|---|---|---|
| San Antonio | 57 | 18 | .760 | - | W9 |
| Houston | 45 | 29 | .608 | 11.5 | W2 |
| Memphis | 25 | 50 | .333 | 32 | L1 |
| New Orleans | 25 | 51 | .329 | 32.5 | L5 |
| Dallas | 24 | 51 | .320 | 33 | L1 |
NBA News
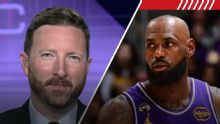
McMenamin: LeBron returning to Cleveland would be 'cleanest fit'
Dave McMenamin examines what LeBron James' future might look like.
2h
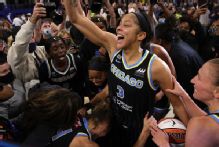
Sources: WNBA's Candace Parker, Elena Delle Donne make HOF
Former WNBA MVPs and champions Candace Parker and Elena Delle Donne, along with former NBA star A'mare Stoudemire and current coach Doc Rivers, will be inducted into the Basketball Hall of Fame in the Class of 2026.
3h

LeBron James confirms shattered backboard in 1-on-1 vs. Bronny
LeBron James wasn't letting a younger Bronny James have a shot at a win, and he broke a backboard in the process.
5h