
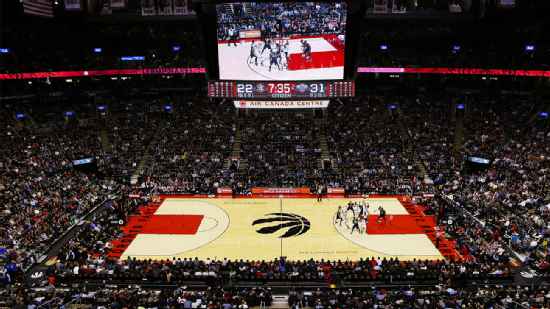
Memphis Grizzlies @ Toronto Raptors

22-23, 9-16 Away
100
22-23, 9-16 Away

13-32, 8-13 Home
98
13-32, 8-13 Home
Game Leaders


Team Stats


44% (41-93)
Field Goal %
48% (40-84)
36% (4-11)
Three Point %
0% (0-13)
70% (14-20)
Free Throw %
75% (18-24)
18
Turnovers
22
55
Rebounds
53
12
Largest Lead
9
Game Information
Toronto, ON
Referee:Zach Zarba
Referee:Nick Buchert
Referee:Greg Willard
Team Stats
 | | |
|---|---|---|
| FG | 41-93 | 40-84 |
| Field Goal % | 44 | 48 |
| 3PT | 4-11 | 0-13 |
| Three Point % | 36 | 0 |
| FT | 14-20 | 18-24 |
| Free Throw % | 70 | 75 |
| Rebounds | 55 | 53 |
| Offensive Rebounds | 18 | 11 |
| Defensive Rebounds | 28 | 31 |
| Assists | 17 | 20 |
| Steals | 6 | 5 |
| Blocks | 8 | 11 |
| Total Turnovers | 18 | 22 |
| Points Conceded Off Turnovers | 9 | 12 |
| Fast Break Points | 25 | 25 |
| Points in Paint | 56 | 54 |
| Fouls | 21 | 15 |
| Technical Fouls | 0 | 0 |
| Flagrant Fouls | 0 | 0 |
| Largest Lead | 12 | 9 |
Matchups
2025-26 Standings
Western Conference
| Southwest | W | L | PCT | GB | STRK |
|---|---|---|---|---|---|
| San Antonio | 41 | 16 | .719 | - | W9 |
| Houston | 35 | 21 | .625 | 5.5 | W1 |
| Memphis | 21 | 35 | .375 | 19.5 | L2 |
| Dallas | 21 | 36 | .368 | 20 | W2 |
| New Orleans | 17 | 42 | .288 | 25 | W2 |
Eastern Conference
| Atlantic | W | L | PCT | GB | STRK |
|---|---|---|---|---|---|
| Boston | 38 | 19 | .667 | - | W4 |
| New York | 37 | 22 | .627 | 2 | L1 |
| Toronto | 34 | 24 | .586 | 4.5 | L1 |
| Philadelphia | 32 | 26 | .552 | 6.5 | W2 |
| Brooklyn | 15 | 42 | .263 | 23 | L5 |
NBA News

McAfee persuades Ishbia to offer $1M prizes for dunk and 3-point contests
Suns owner Mat Ishbia tells Pat McAfee that he will pay $1 million prize for dunk and 3-point contest winners in 2027.
4h

Suns' Mat Ishbia eyes $1M prize for dunk, 3-point contest winners
Suns owner Mat Ishbia wants more star players participating in All-Star Weekend events when Phoenix hosts next year -- and is hoping to entice them by offering a $1 million prize to the winners of the slam dunk and 3-point contests.
4h

Shams: Harden avoids surgery, plans to play through thumb fracture
Shams Charania joins "NBA Today" to report on James Harden's right thumb fracture.
7h