
Boston Celtics @ Golden State Warriors

41-14, 16-9 Away
115
41-14, 16-9 Away

26-30, 19-12 Home
93
26-30, 19-12 Home
Game Leaders


Team Stats


56% (50-90)
Field Goal %
39% (33-84)
41% (7-17)
Three Point %
26% (5-19)
73% (8-11)
Free Throw %
79% (22-28)
36
Turnovers
22
60
Rebounds
40
22
Largest Lead
7
Game Information
Oakland, CA
Referee:Ed Malloy
Referee:Michael Smith
Referee:Haywoode Workman
Team Stats
 | | |
|---|---|---|
| FG | 50-90 | 33-84 |
| Field Goal % | 56 | 39 |
| 3PT | 7-17 | 5-19 |
| Three Point % | 41 | 26 |
| FT | 8-11 | 22-28 |
| Free Throw % | 73 | 79 |
| Rebounds | 60 | 40 |
| Offensive Rebounds | 11 | 11 |
| Defensive Rebounds | 41 | 24 |
| Assists | 35 | 18 |
| Steals | 7 | 11 |
| Blocks | 4 | 8 |
| Total Turnovers | 36 | 22 |
| Points Conceded Off Turnovers | 14 | 23 |
| Fast Break Points | 30 | 22 |
| Points in Paint | 54 | 36 |
| Fouls | 24 | 19 |
| Technical Fouls | 3 | 1 |
| Flagrant Fouls | 0 | 0 |
| Largest Lead | 22 | 7 |
Matchups
2025-26 Standings
Eastern Conference
| Atlantic | W | L | PCT | GB | STRK |
|---|---|---|---|---|---|
| Boston | 38 | 20 | .655 | - | L1 |
| New York | 37 | 22 | .627 | 1.5 | L1 |
| Toronto | 34 | 25 | .576 | 4.5 | L2 |
| Philadelphia | 33 | 26 | .559 | 5.5 | W3 |
| Brooklyn | 15 | 43 | .259 | 23 | L6 |
Western Conference
| Pacific | W | L | PCT | GB | STRK |
|---|---|---|---|---|---|
| LA Lakers | 34 | 24 | .586 | - | L3 |
| Phoenix | 34 | 26 | .567 | 1 | W1 |
| Golden State | 31 | 28 | .525 | 3.5 | W1 |
| LA Clippers | 27 | 31 | .466 | 7 | L3 |
| Sacramento | 14 | 47 | .230 | 21.5 | W1 |
NBA News

'The Hoop Collective': Episodes of Brian Windhorst's NBA podcast
From breaking news to the latest intel from around the NBA, here are the biggest highlights from Brian Windhorst's "The Hoop Collective" podcast.
3h
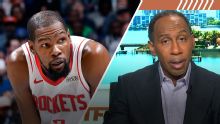
Where Stephen A. ranks Kevin Durant in NBA's all-time list
Stephen A. Smith reacts to Kevin Durant surpassing 32,000 career points in the NBA and his ranking among the greats.
4h

Stephen A. calls out Reaves and Doncic for being 'defensive liabilities'
Stephen A. Smith rips the Lakers after their loss to the Suns on Thursday night.
4h