
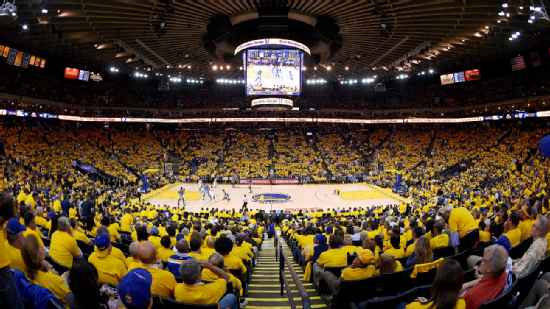
Oklahoma City Thunder @ Golden State Warriors

20-5, 11-4 Away
119
20-5, 11-4 Away

8-14, 6-8 Home
116
8-14, 6-8 Home
Game Leaders


Team Stats


52% (44-84)
Field Goal %
55% (44-80)
42% (11-26)
Three Point %
43% (9-21)
95% (20-21)
Free Throw %
83% (19-23)
30
Turnovers
30
40
Rebounds
41
10
Largest Lead
12
Game Information
Oakland, CA
Referee:Bennie Adams
Referee:Greg Willard
Referee:Derek Richardson
Team Stats
 | | |
|---|---|---|
| FG | 44-84 | 44-80 |
| Field Goal % | 52 | 55 |
| 3PT | 11-26 | 9-21 |
| Three Point % | 42 | 43 |
| FT | 20-21 | 19-23 |
| Free Throw % | 95 | 83 |
| Rebounds | 40 | 41 |
| Offensive Rebounds | 8 | 7 |
| Defensive Rebounds | 25 | 29 |
| Assists | 24 | 28 |
| Steals | 9 | 9 |
| Blocks | 3 | 4 |
| Total Turnovers | 30 | 30 |
| Points Conceded Off Turnovers | 15 | 17 |
| Fast Break Points | 13 | 11 |
| Points in Paint | 44 | 40 |
| Fouls | 25 | 22 |
| Technical Fouls | 0 | 0 |
| Flagrant Fouls | 0 | 0 |
| Largest Lead | 10 | 12 |
Matchups
2025-26 Standings
Western Conference
| Northwest | W | L | PCT | GB | STRK |
|---|---|---|---|---|---|
| Oklahoma City | 48 | 15 | .762 | - | W3 |
| Minnesota | 39 | 23 | .629 | 8.5 | W4 |
| Denver | 38 | 24 | .613 | 9.5 | W1 |
| Portland | 29 | 33 | .468 | 18.5 | L2 |
| Utah | 18 | 43 | .295 | 29 | L6 |
| Pacific | W | L | PCT | GB | STRK |
|---|---|---|---|---|---|
| LA Lakers | 37 | 24 | .607 | - | W3 |
| Phoenix | 35 | 26 | .574 | 2 | W2 |
| Golden State | 31 | 30 | .508 | 6 | L2 |
| LA Clippers | 29 | 31 | .483 | 7.5 | W2 |
| Sacramento | 14 | 49 | .222 | 24 | L2 |
NBA News
Richard Hamilton impressed by current state of the Pistons
Richard Hamilton talks to Rich Eisen about the job Trajan Langdon has done rebuilding the Pistons.
3h

Stephen A. on Lakers: 'They’re all scorers, not shooters'
Stephen A. Smith and Chiney Ogwumike discuss whether or not the Lakers can become a championship team with their current roster.
4h

'The Hoop Collective': Episodes of Brian Windhorst's NBA podcast
From breaking news to the latest intel from around the NBA, here are the biggest highlights from Brian Windhorst's "The Hoop Collective" podcast.
5h