
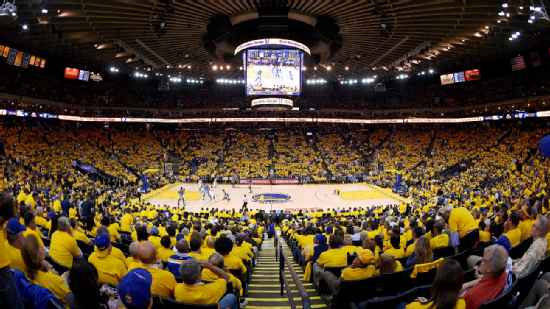
Atlanta Hawks @ Golden State Warriors

10-8, 4-6 Away
100
10-8, 4-6 Away

16-2, 7-1 Home
105
16-2, 7-1 Home
Game Leaders


Team Stats


42% (36-85)
Field Goal %
44% (37-85)
24% (7-29)
Three Point %
34% (12-35)
70% (21-30)
Free Throw %
79% (19-24)
19
Turnovers
15
61
Rebounds
50
7
Largest Lead
8
Game Information
Oakland, CA
Referee:Bennie Adams
Referee:Mark Lindsay
Referee:J.T. Orr
Team Stats
 | | |
|---|---|---|
| FG | 36-85 | 37-85 |
| Field Goal % | 42 | 44 |
| 3PT | 7-29 | 12-35 |
| Three Point % | 24 | 34 |
| FT | 21-30 | 19-24 |
| Free Throw % | 70 | 79 |
| Rebounds | 61 | 50 |
| Offensive Rebounds | 13 | 7 |
| Defensive Rebounds | 37 | 34 |
| Assists | 20 | 25 |
| Steals | 11 | 6 |
| Blocks | 4 | 10 |
| Total Turnovers | 19 | 15 |
| Points Conceded Off Turnovers | 15 | 19 |
| Fast Break Points | 9 | 20 |
| Points in Paint | 34 | 34 |
| Fouls | 22 | 20 |
| Technical Fouls | 0 | 0 |
| Flagrant Fouls | 0 | 0 |
| Largest Lead | 7 | 8 |
Matchups
2025-26 Standings
Eastern Conference
| Southeast | W | L | PCT | GB | STRK |
|---|---|---|---|---|---|
| Orlando | 28 | 25 | .528 | - | L1 |
| Miami | 29 | 27 | .518 | 0.5 | W1 |
| Charlotte | 26 | 29 | .473 | 3 | W1 |
| Atlanta | 26 | 30 | .464 | 3.5 | L3 |
| Washington | 14 | 39 | .264 | 14 | L3 |
Western Conference
| Pacific | W | L | PCT | GB | STRK |
|---|---|---|---|---|---|
| LA Lakers | 33 | 21 | .611 | - | W1 |
| Phoenix | 32 | 23 | .582 | 1.5 | L1 |
| Golden State | 29 | 26 | .527 | 4.5 | L1 |
| LA Clippers | 26 | 28 | .481 | 7 | W1 |
| Sacramento | 12 | 44 | .214 | 22 | L14 |
NBA News

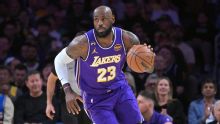
LeBron James becomes oldest with triple-double in NBA history
LeBron James broke the record held by Karl Malone in the Lakers' win over the Mavericks on Thursday night.
5h
Dallas Mavericks vs. Los Angeles Lakers: Game Highlights
Dallas Mavericks vs. Los Angeles Lakers: Game Highlights
7h
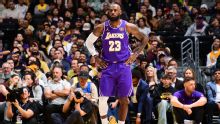
LeBron James becomes oldest player with triple-double in Lakers' 124-104 win over Mavericks
— LeBron James became the oldest player in NBA history with a triple-double when he put up 28 points, 12...
8h