Louisiana Tech Bulldogs @ San Jose State Spartans
Game Leaders
Team Stats
479
Total Yards
522
2
Turnovers
5
25
1st Downs
25
2-15
Penalties
7-60
7/17
3rd Down
5/17
1/1
4th Down
1/1
18:07
Possession
18:33
Game Information
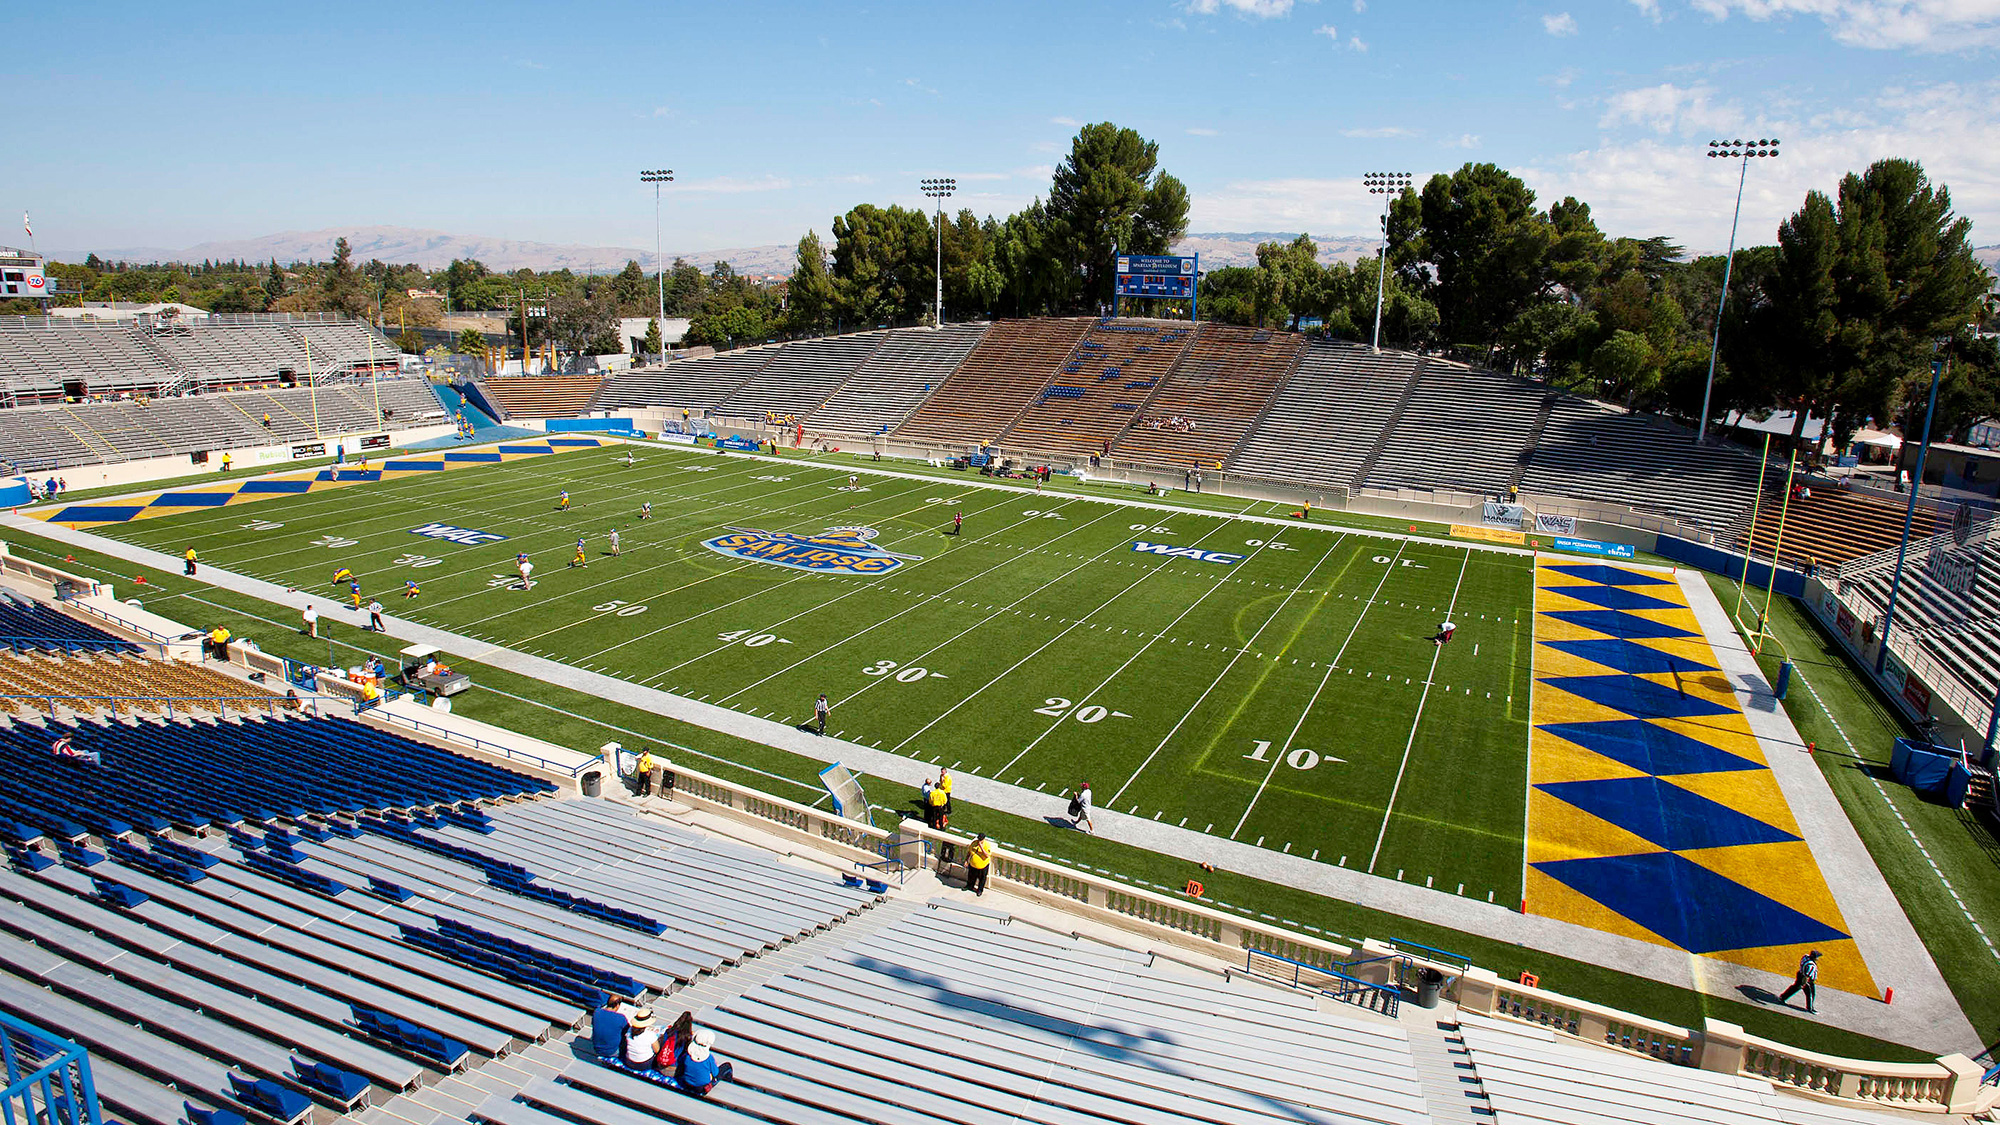
San Jose, CA


Team Stats
| 1st Downs | 25 | 25 |
| 3rd down efficiency | 7-17 | 5-17 |
| 4th down efficiency | 1-1 | 1-1 |
| Total Yards | 479 | 522 |
| Passing | 110 | 522 |
| Comp/Att | 13/28 | 35/66 |
| Yards per pass | 3.8 | 7.5 |
| Interceptions thrown | 1 | 4 |
| Rushing | 374 | 26 |
| Rushing Attempts | 61 | 23 |
| Yards per rush | 6.1 | 1.1 |
| Penalties | 2-15 | 7-60 |
| Turnovers | 2 | 5 |
| Fumbles lost | 1 | 1 |
| Interceptions thrown | 1 | 4 |
| Possession | 18:07 | 18:33 |
2025 Standings
FBS
| Conference USAConference USA | CONF | OVR |
|---|---|---|
| Kennesaw State | 7-1 | 10-4 |
| Jacksonville State | 7-1 | 9-5 |
| Western Kentucky | 6-2 | 9-4 |
| Louisiana Tech | 5-3 | 8-5 |
| Missouri State | 5-3 | 7-6 |
| Florida International | 5-3 | 7-6 |
| Delaware | 4-4 | 7-6 |
| Liberty | 3-5 | 4-8 |
| Middle Tennessee | 2-6 | 3-9 |
| New Mexico State | 2-6 | 4-8 |
| UTEP | 1-7 | 2-10 |
| Sam Houston | 1-7 | 2-10 |
NCAAF News

Senior Bowl practices for 2026 NFL draft: Best QBs, prospects
Here are the top NFL draft risers from the final day of Senior Bowl practices, with Altmyer making a move.
8h

Sen. Ted Cruz against idea of college athletes as employees
Sen. Ted Cruz told ESPN it's critical that any federal law related to college sports includes a provision that prevents athletes from being deemed school employees.
11h

Fiesta Bowl to host women's flag football tournament April 18-19
The Fiesta Bowl will host an eight-team women's collegiate flag football tournament in April, the Fiesta Sports Foundation announced Thursday.
15h
GAMBLING PROBLEM? CALL 1-800-GAMBLER, (800) 327-5050 or visit gamblinghelplinema.org (MA). Call 877-8-HOPENY/text HOPENY (467369) (NY). Please Gamble Responsibly. 888-789-7777/visit ccpg.org (CT), or visit www.mdgamblinghelp.org (MD). 21+ and present in most states. (18+ DC/KY/NH/WY). Void in ONT/OR/NH. Eligibility restrictions apply. On behalf of Boot Hill Casino & Resort (KS). Terms: sportsbook.draftkings.com/promos.
Copyright: © 2026 ESPN Enterprises, Inc. All rights reserved.


