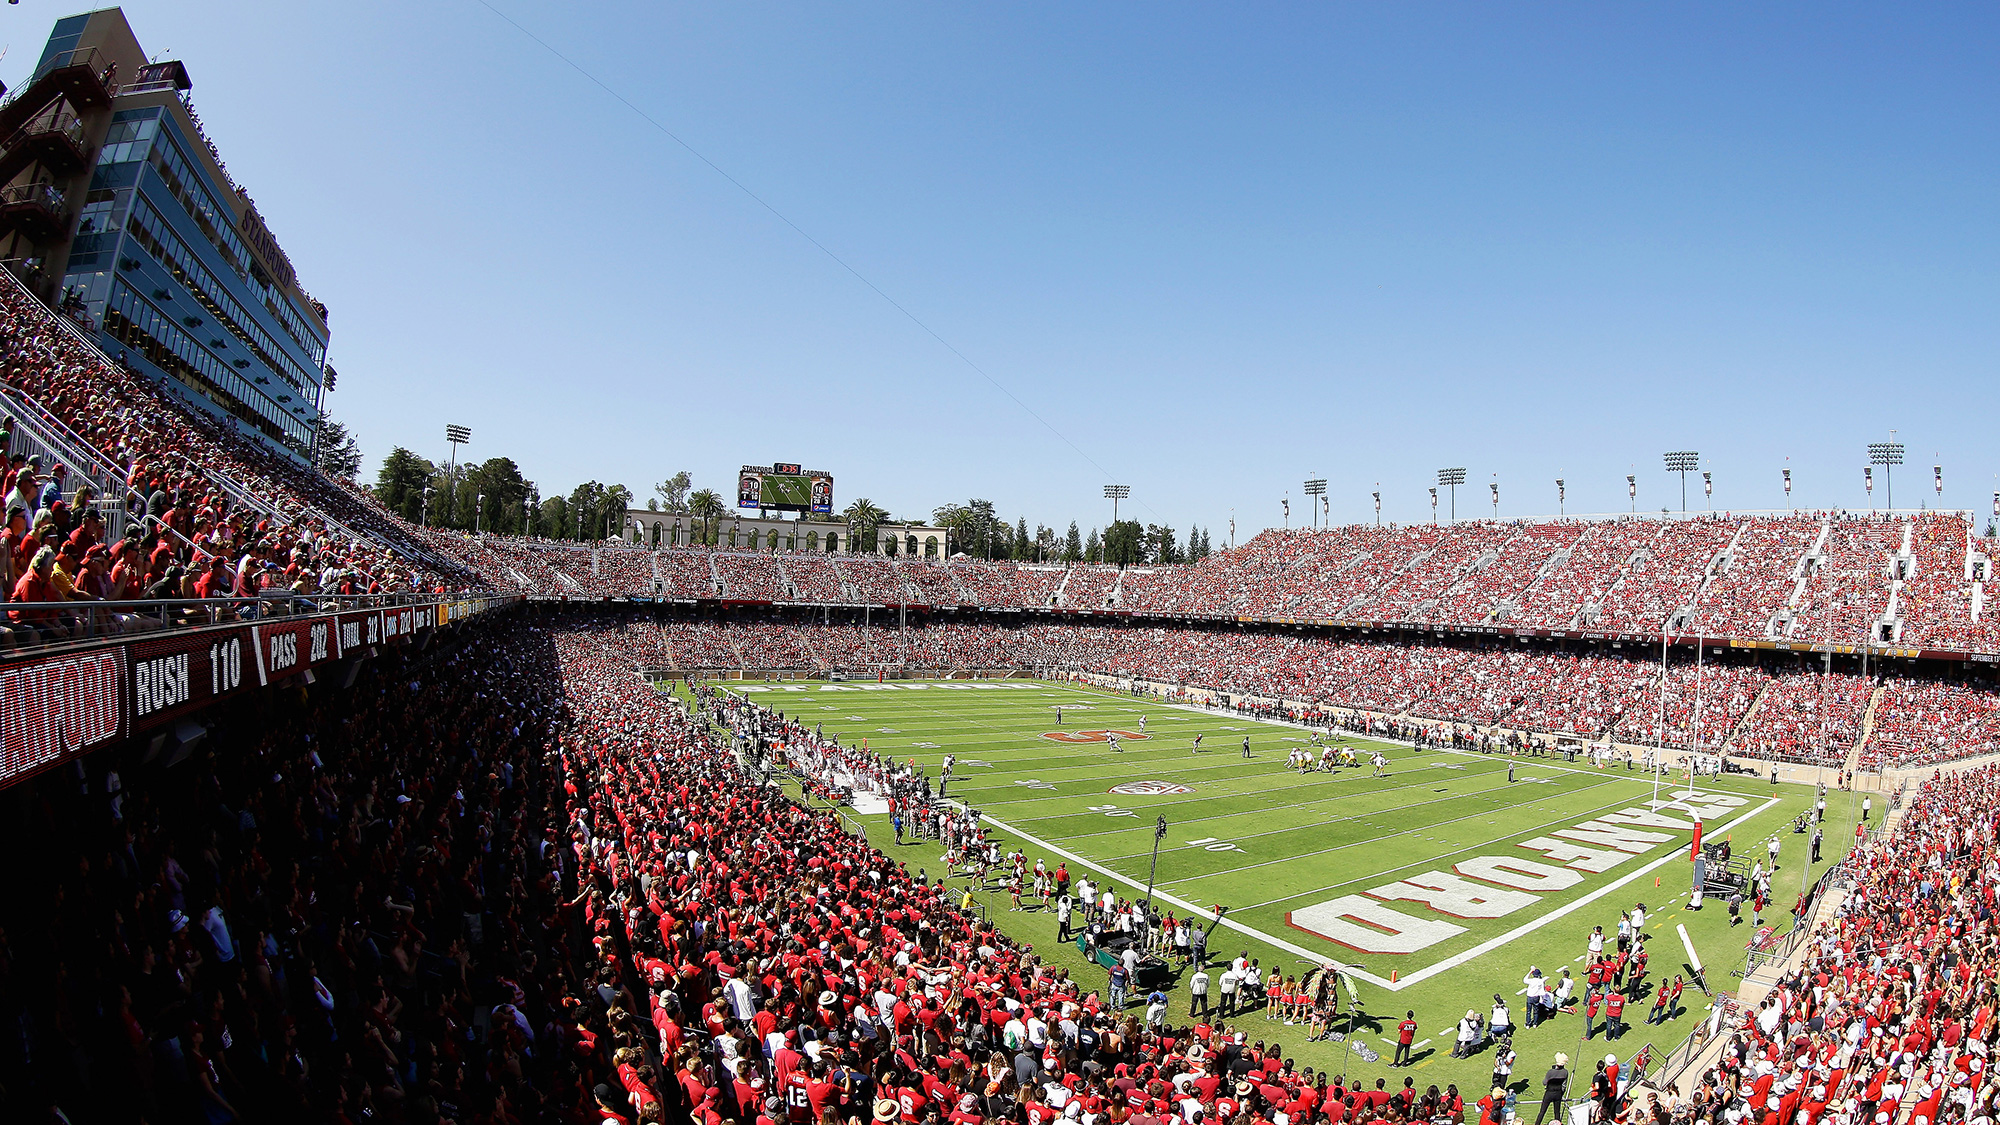
San Diego State Aztecs @ Stanford Cardinal
Game Leaders
Team Stats
263
Total Yards
382
1
Turnovers
1
11
1st Downs
19
11-125
Penalties
3-20
4/13
3rd Down
7/15
0/1
4th Down
0/0
28:50
Possession
31:10
Game Information
Stanford, CA


Team Stats
| 1st Downs | 11 | 19 |
| 3rd down efficiency | 4-13 | 7-15 |
| 4th down efficiency | 0-1 | 0-0 |
| Total Yards | 263 | 382 |
| Passing | 113 | 332 |
| Comp/Att | 10/15 | 21/31 |
| Yards per pass | 7.5 | 10.7 |
| Interceptions thrown | 0 | 1 |
| Rushing | 150 | 50 |
| Rushing Attempts | 37 | 28 |
| Yards per rush | 4.1 | 1.8 |
| Penalties | 11-125 | 3-20 |
| Turnovers | 1 | 1 |
| Fumbles lost | 1 | 0 |
| Interceptions thrown | 0 | 1 |
| Possession | 28:50 | 31:10 |
SDSU @ STAN Videos
Stanford opening up the lead with another TD pass
- 0:29
Stanford WR all alone in the end zone for an easy score
- 0:38
Stanford takes the lead after a beautiful touchdown pass and catch right before half
- 0:47
2025 Standings
FBS
| Pac-12 ConferencePac-12 Conference | CONF | OVR |
|---|---|---|
| Washington State | 1-1 | 7-6 |
| Oregon State | 1-1 | 2-10 |
FBS
| Atlantic Coast ConferenceAtlantic Coast Conference | CONF | OVR |
|---|---|---|
| Virginia | 7-1 | 11-3 |
| SMU | 6-2 | 9-4 |
| Miami | 6-2 | 13-3 |
| Pittsburgh | 6-2 | 8-5 |
| Georgia Tech | 6-2 | 9-4 |
| Duke | 6-2 | 9-5 |
| NC State | 4-4 | 8-5 |
| California | 4-4 | 7-6 |
| Clemson | 4-4 | 7-6 |
| Louisville | 4-4 | 9-4 |
| Wake Forest | 4-4 | 9-4 |
| Stanford | 3-5 | 4-8 |
| Florida State | 2-6 | 5-7 |
| North Carolina | 2-6 | 4-8 |
| Virginia Tech | 2-6 | 3-9 |
| Boston College | 1-7 | 2-10 |
| Syracuse | 1-7 | 3-9 |
NCAAF News

Best college football transfer portal addition for top 25 teams
A look at the incoming transfers who will have the biggest impact on the best teams in 2026.
7h

For college football's future, be careful to understand how it grew and succeeded
The sport's manifest destiny opened doors for Indiana and others. Consolidating power and access could eliminate the thrill of that growth.
1d

Why John Beam's legacy extends beyond the football field
Kimberley A. Martin reports on how football coach John Beam, who was killed in 2025, left an indelible mark beyond the football field.
2d
GAMBLING PROBLEM? CALL 1-800-GAMBLER, (800) 327-5050 or visit gamblinghelplinema.org (MA). Call 877-8-HOPENY/text HOPENY (467369) (NY). Please Gamble Responsibly. 888-789-7777/visit ccpg.org (CT), or visit www.mdgamblinghelp.org (MD). 21+ and present in most states. (18+ DC/KY/NH/WY). Void in ONT/OR/NH. Eligibility restrictions apply. On behalf of Boot Hill Casino & Resort (KS). Terms: sportsbook.draftkings.com/promos.
Copyright: © 2026 ESPN Enterprises, Inc. All rights reserved.


