
Florida State Seminoles @ NC State Wolfpack

6-2, 2-2 Away
24
6-2, 2-2 Away

6-2, 4-1 Home
28
6-2, 4-1 Home
Game Leaders


196
C. PonderQB
17/28, 1 TD
196
178
R. WilsonQB
18/28, 1 TD, 1 INT
178
108
T. JonesRB
10 CAR
108
76
M. GreeneRB
17 CAR
76
87
B. ReedWR
6 REC
87
44
D. DavisWR
2 REC
44
1
M. WhiteDE
1
2
N. MageoDT
2
15
K. SmithLB
9 SOLO
15
9
E. WolffS
5 SOLO
9
Team Stats


373
Total Yards
367
2
Turnovers
2
15
1st Downs
23
10-81
Penalties
9-60
8/14
3rd Down
12/18
0/0
4th Down
2/2
16:31
Possession
20:05
Game Information
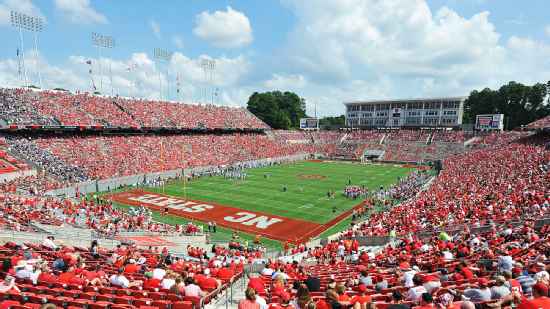
Raleigh, NC
Team Stats
 | | |
|---|---|---|
| 1st Downs | 15 | 23 |
| 3rd down efficiency | 8-14 | 12-18 |
| 4th down efficiency | 0-0 | 2-2 |
| Total Yards | 373 | 367 |
| Passing | 210 | 199 |
| Comp/Att | 17/28 | 18/28 |
| Yards per pass | 7.0 | 6.4 |
| Interceptions thrown | 0 | 1 |
| Rushing | 177 | 189 |
| Rushing Attempts | 33 | 53 |
| Yards per rush | 5.4 | 3.6 |
| Penalties | 10-81 | 9-60 |
| Turnovers | 2 | 2 |
| Fumbles lost | 2 | 1 |
| Interceptions thrown | 0 | 1 |
| Possession | 16:31 | 20:05 |
2025 Standings
FBS
| Atlantic Coast Conference | CONF | OVR |
|---|---|---|
| Virginia | 7-1 | 11-3 |
| SMU | 6-2 | 9-4 |
| Miami | 6-2 | 13-3 |
| Pittsburgh | 6-2 | 8-5 |
| Georgia Tech | 6-2 | 9-4 |
| Duke | 6-2 | 9-5 |
| NC State | 4-4 | 8-5 |
| California | 4-4 | 7-6 |
| Clemson | 4-4 | 7-6 |
| Louisville | 4-4 | 9-4 |
| Wake Forest | 4-4 | 9-4 |
| Stanford | 3-5 | 4-8 |
| Florida State | 2-6 | 5-7 |
| North Carolina | 2-6 | 4-8 |
| Virginia Tech | 2-6 | 3-9 |
| Boston College | 1-7 | 2-10 |
| Syracuse | 1-7 | 3-9 |
NCAAF News

2026 college football recruiting class rankings: Top 75 schools
We shuffle the 2026 recruiting class rankings with the final signing period right around the corner.
2h

Ranking the best players in the college football transfer portal
The transfer portal closed Jan. 16. Here's your guide to the best players on the move this offseason.
9h

Senior Bowl practices for 2026 NFL draft: Best QBs, prospects
Here are the top NFL draft risers from the final day of Senior Bowl practices, with Altmyer making a move.
20h