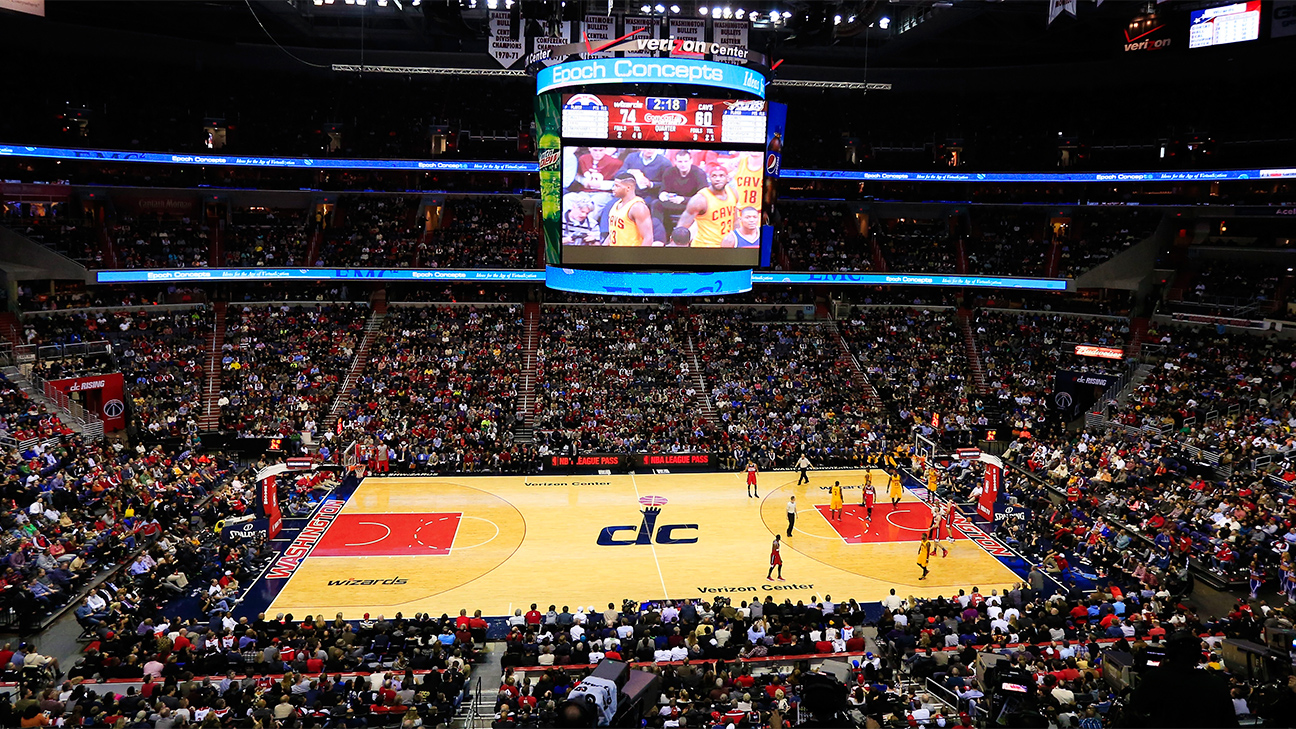
Detroit Pistons @ Washington Wizards
Detroit Pistons
starters |
bench |
team |
MIN | PTS | FG | 3PT | FT | REB | AST | TO | STL | BLK | OREB | DREB | PF | +/- |
| 37 | 6 | 3-6 | 0-0 | 0-0 | 11 | 0 | 2 | 1 | 1 | 1 | 10 | 3 | 0 |
| 39 | 5 | 1-7 | 0-1 | 3-4 | 5 | 3 | 1 | 1 | 0 | 2 | 3 | 1 | 0 |
| 18 | 6 | 2-6 | 0-0 | 2-2 | 7 | 0 | 0 | 1 | 1 | 1 | 6 | 2 | 0 |
| 41 | 22 | 6-15 | 3-4 | 7-8 | 7 | 6 | 4 | 1 | 0 | 1 | 6 | 2 | 0 |
| 42 | 25 | 11-16 | 0-0 | 3-3 | 3 | 3 | 4 | 1 | 0 | 1 | 2 | 3 | 0 |
MIN | PTS | FG | 3PT | FT | REB | AST | TO | STL | BLK | OREB | DREB | PF | +/- |
| 10 | 0 | 0-0 | 0-0 | 0-0 | 3 | 0 | 0 | 1 | 0 | 0 | 3 | 2 | 0 |
| 19 | 5 | 2-6 | 0-0 | 1-2 | 5 | 1 | 1 | 0 | 0 | 2 | 3 | 1 | 0 |
| 22 | 10 | 2-6 | 0-1 | 6-8 | 3 | 0 | 2 | 1 | 0 | 1 | 2 | 3 | 0 |
| 12 | 1 | 0-4 | 0-0 | 1-2 | 3 | 1 | 1 | 0 | 0 | 2 | 1 | 2 | 0 |
| -- | 0 | 0-0 | 0-0 | 0-0 | 0 | 0 | 0 | 0 | 0 | 0 | 0 | 0 | 0 |
80 | 27-66 | 3-6 | 23-29 | 47 | 14 | 15 | 7 | 2 | 11 | 36 | 19 | ||
41% | 50% | 79% |
Washington Wizards
starters |
bench |
team |
MIN | PTS | FG | 3PT | FT | REB | AST | TO | STL | BLK | OREB | DREB | PF | +/- |
| 42 | 6 | 3-11 | 0-1 | 0-2 | 4 | 0 | 3 | 0 | 0 | 1 | 3 | 4 | 0 |
| 13 | 5 | 2-6 | 0-0 | 1-2 | 4 | 0 | 2 | 0 | 2 | 0 | 4 | 4 | 0 |
| 36 | 23 | 10-16 | 0-0 | 3-5 | 11 | 0 | 1 | 0 | 1 | 6 | 5 | 3 | 0 |
| 20 | 5 | 1-4 | 1-2 | 2-2 | 0 | 0 | 0 | 0 | 1 | 0 | 0 | 3 | 0 |
| 34 | 15 | 6-13 | 2-4 | 1-2 | 7 | 2 | 4 | 5 | 0 | 1 | 6 | 1 | 0 |
MIN | PTS | FG | 3PT | FT | REB | AST | TO | STL | BLK | OREB | DREB | PF | +/- |
| 21 | 2 | 1-2 | 0-0 | 0-0 | 4 | 0 | 1 | 0 | 0 | 2 | 2 | 3 | 0 |
| 26 | 9 | 4-10 | 0-1 | 1-3 | 6 | 2 | 1 | 2 | 0 | 2 | 4 | 4 | 0 |
| 9 | 0 | 0-1 | 0-0 | 0-0 | 0 | 3 | 0 | 1 | 0 | 0 | 0 | 2 | 0 |
| 13 | 0 | 0-4 | 0-2 | 0-0 | 1 | 3 | 0 | 1 | 0 | 0 | 1 | 1 | 0 |
| 6 | 0 | 0-1 | 0-0 | 0-0 | 1 | 0 | 0 | 0 | 0 | 0 | 1 | 1 | 0 |
| 20 | 4 | 1-6 | 0-1 | 2-2 | 0 | 1 | 2 | 0 | 0 | 0 | 0 | 2 | 0 |
69 | 28-74 | 3-11 | 10-18 | 38 | 11 | 16 | 9 | 4 | 12 | 26 | 28 | ||
38% | 27% | 56% |
+/- denotes team's net points while the player is on the court
Matchups
Game Information
Washington, DC

Referee:Joe Crawford
Referee:Phil Robinson
Referee:James Capers

2025-26 Standings
NBA News

Shams: NBA expected to make decision on expansion later this year
Shams Charania joins "NBA Today" and elaborates on his reporting about the potential upcoming NBA expansion.
3h

Will Jaren Jackson Jr. be ready for the start of next season?
Tim MacMahon reports on the Jazz's Jaren Jackson Jr.'s season-ending surgery.
3h

Suns' Dillon Brooks gets 1-game ban after 16th technical foul
Suns forward Dillon Brooks has been suspended one game after receiving his 16th technical foul of the season. He will sit out against the Spurs on Feb. 19.
4h
GAMBLING PROBLEM? CALL 1-800-GAMBLER, (800) 327-5050 or visit gamblinghelplinema.org (MA). Call 877-8-HOPENY/text HOPENY (467369) (NY). Please Gamble Responsibly. 888-789-7777/visit ccpg.org (CT), or visit www.mdgamblinghelp.org (MD). 21+ and present in most states. (18+ DC/KY/NH/WY). Void in ONT/OR/NH. Eligibility restrictions apply. On behalf of Boot Hill Casino & Resort (KS). Terms: sportsbook.draftkings.com/promos.
Copyright: © 2026 ESPN Enterprises, Inc. All rights reserved.


