
Detroit Pistons @ Philadelphia 76ers

23-10, 10-7 Away
103
23-10, 10-7 Away

19-16, 13-4 Home
94
19-16, 13-4 Home
Game Leaders


Team Stats


46% (36-78)
Field Goal %
39% (31-79)
44% (7-16)
Three Point %
29% (2-7)
89% (24-27)
Free Throw %
79% (30-38)
16
Turnovers
14
47
Rebounds
54
Game Information
Philadelphia, PA

Referee:Dan Crawford
Referee:Ron Olesiak
Referee:Bennie Adams
Team Stats
 | | |
|---|---|---|
| FG | 36-78 | 31-79 |
| Field Goal % | 46 | 39 |
| 3PT | 7-16 | 2-7 |
| Three Point % | 44 | 29 |
| FT | 24-27 | 30-38 |
| Free Throw % | 89 | 79 |
| Rebounds | 47 | 54 |
| Offensive Rebounds | 10 | 16 |
| Defensive Rebounds | 33 | 30 |
| Assists | 21 | 19 |
| Steals | 9 | 9 |
| Blocks | 7 | 4 |
| Total Turnovers | 16 | 14 |
| Points Conceded Off Turnovers | 25 | 17 |
| Fast Break Points | 4 | 2 |
| Points in Paint | -1 | -1 |
| Fouls | 32 | 28 |
| Technical Fouls | 0 | 1 |
| Flagrant Fouls | 0 | 0 |
Matchups
2025-26 Standings
NBA News
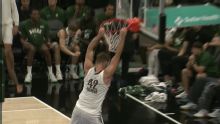
Duke Brennan throws down big slam vs. Milwaukee Bucks
Duke Brennan throws down big slam vs. Milwaukee Bucks
11h

Why Darryn Peterson, Cam Boozer stood out in summer league debuts
Why Darryn Peterson, Cam Boozer stood out in summer league debuts
17h
Mitchell Robinson: Playoff injury was reaction to family incident
New Celtics center Mitchell Robinson addressed the hand injury that put his status for the start of the Knicks' NBA Finals appearance in doubt, saying he was hurt after reacting to a family member being in a car crash.
18h