
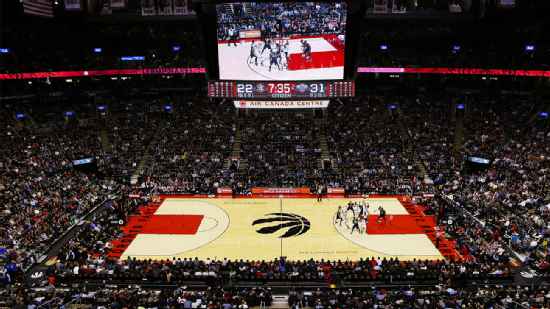
Miami Heat @ Toronto Raptors

48-23, 20-16 Away
98
48-23, 20-16 Away

26-45, 14-21 Home
94
26-45, 14-21 Home
Game Leaders


Team Stats


42% (34-81)
Field Goal %
45% (37-83)
24% (4-17)
Three Point %
29% (6-21)
81% (26-32)
Free Throw %
82% (14-17)
16
Turnovers
10
60
Rebounds
42
4
Largest Lead
16
Game Information
Toronto, ON
Referee:Jason Phillips
Referee:Michael Smith
Referee:Ken Mauer
Team Stats
 | | |
|---|---|---|
| FG | 34-81 | 37-83 |
| Field Goal % | 42 | 45 |
| 3PT | 4-17 | 6-21 |
| Three Point % | 24 | 29 |
| FT | 26-32 | 14-17 |
| Free Throw % | 81 | 82 |
| Rebounds | 60 | 42 |
| Offensive Rebounds | 15 | 8 |
| Defensive Rebounds | 36 | 31 |
| Assists | 13 | 21 |
| Steals | 4 | 8 |
| Blocks | 2 | 5 |
| Total Turnovers | 16 | 10 |
| Points Conceded Off Turnovers | 9 | 22 |
| Fast Break Points | 8 | 14 |
| Points in Paint | -1 | -1 |
| Fouls | 15 | 25 |
| Technical Fouls | 0 | 2 |
| Flagrant Fouls | 0 | 0 |
| Largest Lead | 4 | 16 |
Matchups
2025-26 Standings
Eastern Conference
| Southeast | W | L | PCT | GB | STRK |
|---|---|---|---|---|---|
| Atlanta | 46 | 36 | .561 | - | L1 |
| Orlando | 45 | 37 | .549 | 1 | L1 |
| Charlotte | 44 | 38 | .537 | 2 | W1 |
| Miami | 43 | 39 | .524 | 3 | W2 |
| Washington | 17 | 65 | .207 | 29 | L10 |
| Atlantic | W | L | PCT | GB | STRK |
|---|---|---|---|---|---|
| Boston | 56 | 26 | .683 | - | W2 |
| New York | 53 | 29 | .646 | 3 | L1 |
| Toronto | 46 | 36 | .561 | 10 | W1 |
| Philadelphia | 45 | 37 | .549 | 11 | W2 |
| Brooklyn | 20 | 62 | .244 | 36 | L3 |
NBA News
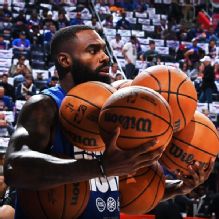
Tim Hardaway Jr.: Prayers answered with deal to join Heat
The Heat formally introduced part of the family Wednesday, with Tim Hardaway Jr. getting his welcome-back-to-Miami news conference -- and getting handed a No. 10 Heat jersey, only this one with "Jr." after the family surname on the back.
2h
Austin Reaves shares text to LeBron after hearing he was leaving Lakers
The Los Angeles Lakers guard and LeBron James shared a close relationship while teammates for five seasons.
3h
2026 NBA buzz: Latest free agency and trade updates
We're tracking deals, trades and buzz across the NBA, including Donovan Mitchell agreeing to an extension with the Cavs.
2h