
Miami Heat @ Houston Rockets

20-18, 9-8 Away
115
20-18, 9-8 Away

22-18, 12-5 Home
106
22-18, 12-5 Home
Game Leaders


Team Stats


54% (45-84)
Field Goal %
49% (37-76)
43% (6-14)
Three Point %
52% (11-21)
83% (19-23)
Free Throw %
84% (21-25)
9
Turnovers
17
42
Rebounds
44
18
Largest Lead
10
Game Information
Houston, TX
Referee:Marc Davis
Referee:Dan Crawford
Team Stats
 | | |
|---|---|---|
| FG | 45-84 | 37-76 |
| Field Goal % | 54 | 49 |
| 3PT | 6-14 | 11-21 |
| Three Point % | 43 | 52 |
| FT | 19-23 | 21-25 |
| Free Throw % | 83 | 84 |
| Rebounds | 42 | 44 |
| Offensive Rebounds | 9 | 8 |
| Defensive Rebounds | 28 | 28 |
| Assists | 24 | 20 |
| Steals | 8 | 6 |
| Blocks | 10 | 4 |
| Total Turnovers | 9 | 17 |
| Points Conceded Off Turnovers | 24 | 10 |
| Fast Break Points | 9 | 15 |
| Points in Paint | 34 | 42 |
| Fouls | 20 | 21 |
| Technical Fouls | 0 | 0 |
| Flagrant Fouls | 0 | 0 |
| Largest Lead | 18 | 10 |
Matchups
2025-26 Standings
Eastern Conference
| Southeast | W | L | PCT | GB | STRK |
|---|---|---|---|---|---|
| Atlanta | 46 | 36 | .561 | - | L1 |
| Orlando | 45 | 37 | .549 | 1 | L1 |
| Charlotte | 44 | 38 | .537 | 2 | W1 |
| Miami | 43 | 39 | .524 | 3 | W2 |
| Washington | 17 | 65 | .207 | 29 | L10 |
Western Conference
| Southwest | W | L | PCT | GB | STRK |
|---|---|---|---|---|---|
| San Antonio | 62 | 20 | .756 | - | L1 |
| Houston | 52 | 30 | .634 | 10 | W1 |
| New Orleans | 26 | 56 | .317 | 36 | L2 |
| Dallas | 26 | 56 | .317 | 36 | W1 |
| Memphis | 25 | 57 | .305 | 37 | L8 |
NBA News
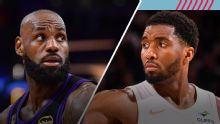
What does Donovan Mitchell extension mean for Cavs' future, pursuit of LeBron?
What does Donovan Mitchell extension mean for Cavs' future, pursuit of LeBron?
32m
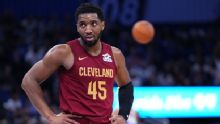
2026 NBA buzz: Latest free agency and trade updates
We're tracking deals, trades and buzz across the NBA, including Donovan Mitchell agreeing to an extension with the Cavs.
44m

Sources: Lakers continue pursuit of free agent Jonathan Kuminga
The Lakers continue to pursue unrestricted free agent wing Jonathan Kuminga, but they have not yet given him an enticing enough offer to commit, sources told ESPN.
1h