
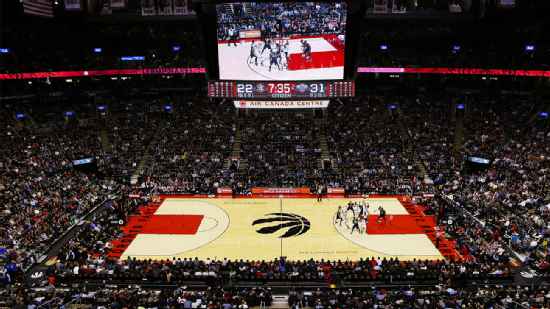
Miami Heat @ Toronto Raptors

23-22, 10-11 Away
103
23-22, 10-11 Away

24-22, 16-6 Home
111
24-22, 16-6 Home
Game Leaders


Team Stats


44% (40-90)
Field Goal %
57% (46-81)
23% (5-22)
Three Point %
40% (4-10)
86% (18-21)
Free Throw %
68% (15-22)
7
Turnovers
14
42
Rebounds
53
13
Largest Lead
9
Game Information
Toronto, ON
Referee:Joe DeRosa
Referee:Ed Malloy
Referee:Nick Buchert
Team Stats
 | | |
|---|---|---|
| FG | 40-90 | 46-81 |
| Field Goal % | 44 | 57 |
| 3PT | 5-22 | 4-10 |
| Three Point % | 23 | 40 |
| FT | 18-21 | 15-22 |
| Free Throw % | 86 | 68 |
| Rebounds | 42 | 53 |
| Offensive Rebounds | 12 | 11 |
| Defensive Rebounds | 23 | 35 |
| Assists | 17 | 28 |
| Steals | 11 | 5 |
| Blocks | 4 | 2 |
| Total Turnovers | 7 | 14 |
| Points Conceded Off Turnovers | 17 | 7 |
| Fast Break Points | 19 | 20 |
| Points in Paint | 46 | 50 |
| Fouls | 18 | 16 |
| Technical Fouls | 0 | 2 |
| Flagrant Fouls | 0 | 0 |
| Largest Lead | 13 | 9 |
Matchups
2025-26 Standings
Eastern Conference
| Southeast | W | L | PCT | GB | STRK |
|---|---|---|---|---|---|
| Atlanta | 46 | 36 | .561 | - | L1 |
| Orlando | 45 | 37 | .549 | 1 | L1 |
| Charlotte | 44 | 38 | .537 | 2 | W1 |
| Miami | 43 | 39 | .524 | 3 | W2 |
| Washington | 17 | 65 | .207 | 29 | L10 |
| Atlantic | W | L | PCT | GB | STRK |
|---|---|---|---|---|---|
| Boston | 56 | 26 | .683 | - | W2 |
| New York | 53 | 29 | .646 | 3 | L1 |
| Toronto | 46 | 36 | .561 | 10 | W1 |
| Philadelphia | 45 | 37 | .549 | 11 | W2 |
| Brooklyn | 20 | 62 | .244 | 36 | L3 |
NBA News
2026 NBA buzz: Latest free agency and trade updates
We're tracking deals, trades and buzz across the NBA, including Donovan Mitchell agreeing to an extension with the Cavs.
3h

2026 NBA free agency: Grades for offseason signings, extensions
We're grading the biggest free agent signings and extensions, including the Cavaliers signing Mitchell to a nearly $275M deal.
3h
Kyle Lowry retires after signing one-day contract with Raptors
Six-time All-Star Kyle Lowry has retired after signing a one-day contract with the Toronto Raptors, where he spent nine of his 20 NBA seasons and won an NBA championship
3h