
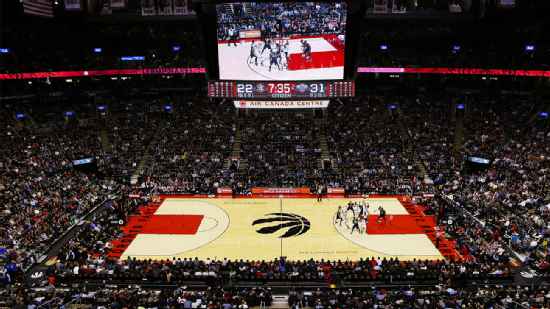
Cleveland Cavaliers @ Toronto Raptors

46-14, 21-10 Away
126
46-14, 21-10 Away

31-26, 21-9 Home
118
31-26, 21-9 Home
Game Leaders


Team Stats


51% (42-82)
Field Goal %
48% (45-93)
38% (11-29)
Three Point %
32% (8-25)
86% (31-36)
Free Throw %
80% (20-25)
15
Turnovers
10
55
Rebounds
43
12
Largest Lead
3
Game Information
Toronto, ON
Referee:Bill Spooner
Referee:Eric Lewis
Referee:Leroy Richardson
Team Stats
 | | |
|---|---|---|
| FG | 42-82 | 45-93 |
| Field Goal % | 51 | 48 |
| 3PT | 11-29 | 8-25 |
| Three Point % | 38 | 32 |
| FT | 31-36 | 20-25 |
| Free Throw % | 86 | 80 |
| Rebounds | 55 | 43 |
| Offensive Rebounds | 12 | 11 |
| Defensive Rebounds | 30 | 20 |
| Assists | 29 | 23 |
| Steals | 6 | 4 |
| Blocks | 3 | 0 |
| Total Turnovers | 15 | 10 |
| Points Conceded Off Turnovers | 22 | 21 |
| Fast Break Points | 30 | 16 |
| Points in Paint | 44 | 50 |
| Fouls | 25 | 26 |
| Technical Fouls | 0 | 1 |
| Flagrant Fouls | 0 | 0 |
| Largest Lead | 12 | 3 |
Matchups
2025-26 Standings
NBA News
Golden State Warriors vs. Dallas Mavericks: Game Highlights
Golden State Warriors vs. Dallas Mavericks: Game Highlights
36m
Detroit Pistons vs. Philadelphia 76ers: Game Highlights
Detroit Pistons vs. Philadelphia 76ers: Game Highlights
2h
Steph Curry's free agency pitch to LeBron James
Steph Curry's free agency pitch to LeBron James
2h