
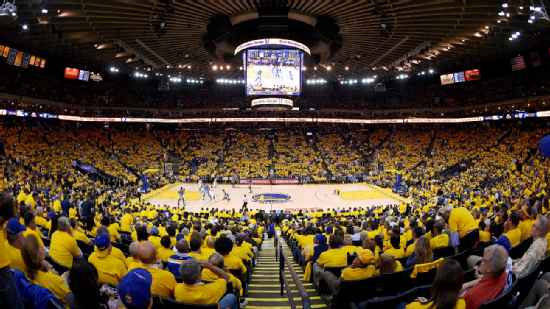
New York Knicks @ Golden State Warriors

5-8, 4-4 Away
125
5-8, 4-4 Away

7-5, 5-1 Home
119
7-5, 5-1 Home
Game Leaders


Team Stats


57% (44-77)
Field Goal %
52% (47-91)
43% (10-23)
Three Point %
54% (13-24)
84% (27-32)
Free Throw %
71% (12-17)
18
Turnovers
10
48
Rebounds
39
18
Largest Lead
7
Game Information
Oakland, CA
Referee:Ron Garretson
Referee:Tom Washington
Referee:Eric Dalen
Team Stats
 | | |
|---|---|---|
| FG | 44-77 | 47-91 |
| Field Goal % | 57 | 52 |
| 3PT | 10-23 | 13-24 |
| Three Point % | 43 | 54 |
| FT | 27-32 | 12-17 |
| Free Throw % | 84 | 71 |
| Rebounds | 48 | 39 |
| Offensive Rebounds | 12 | 10 |
| Defensive Rebounds | 31 | 23 |
| Assists | 31 | 24 |
| Steals | 7 | 7 |
| Blocks | 7 | 2 |
| Total Turnovers | 18 | 10 |
| Points Conceded Off Turnovers | 16 | 19 |
| Fast Break Points | 16 | 20 |
| Points in Paint | 52 | 38 |
| Fouls | 16 | 25 |
| Technical Fouls | 1 | 0 |
| Flagrant Fouls | 0 | 0 |
| Largest Lead | 18 | 7 |
Matchups
2025-26 Standings
Eastern Conference
| Atlantic | W | L | PCT | GB | STRK |
|---|---|---|---|---|---|
| Boston | 56 | 26 | .683 | - | W2 |
| New York | 53 | 29 | .646 | 3 | L1 |
| Toronto | 46 | 36 | .561 | 10 | W1 |
| Philadelphia | 45 | 37 | .549 | 11 | W2 |
| Brooklyn | 20 | 62 | .244 | 36 | L3 |
Western Conference
| Pacific | W | L | PCT | GB | STRK |
|---|---|---|---|---|---|
| LA Lakers | 53 | 29 | .646 | - | W3 |
| Phoenix | 45 | 37 | .549 | 8 | W1 |
| LA Clippers | 42 | 40 | .512 | 11 | W1 |
| Golden State | 37 | 45 | .451 | 16 | L3 |
| Sacramento | 22 | 60 | .268 | 31 | L1 |
NBA News
Sources: Warriors to hire Frank Vogel as associate head coach
The Warriors agreed to hire longtime NBA coach Frank Vogel as the associate head coach under Steve Kerr, league sources told ESPN, filling the void left by the departing Terry Stotts.
1h
Yaxel Lendeborg hits the 3 over former Michigan teammate Aday Mara
Yaxel Lendeborg hits the 3 over former Michigan teammate Aday Mara
1h
2026 NBA buzz: Latest summer league, free agency, trade updates
We're tracking deals, trades and buzz across the NBA, including the latest on AJ Dybantsa and other rookies at summer league.
1h