
Los Angeles Lakers @ Utah Jazz

13-3, 5-2 Away
96
13-3, 5-2 Away

12-5, 6-3 Home
102
12-5, 6-3 Home
Game Leaders


Team Stats


42% (33-79)
Field Goal %
49% (39-79)
27% (4-15)
Three Point %
41% (7-17)
84% (26-31)
Free Throw %
89% (17-19)
6
Turnovers
10
45
Rebounds
48
19
Largest Lead
6
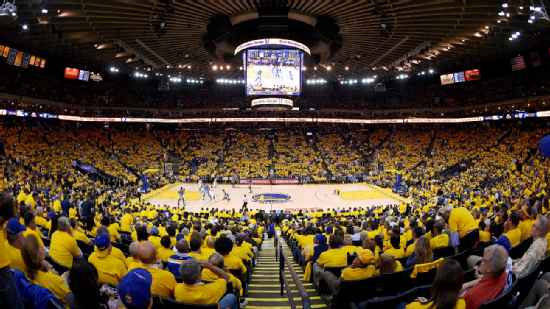
Game Information
Oakland, CA
Team Stats
 | | |
|---|---|---|
| FG | 33-79 | 39-79 |
| Field Goal % | 42 | 49 |
| 3PT | 4-15 | 7-17 |
| Three Point % | 27 | 41 |
| FT | 26-31 | 17-19 |
| Free Throw % | 84 | 89 |
| Rebounds | 45 | 48 |
| Offensive Rebounds | 9 | 6 |
| Defensive Rebounds | 29 | 36 |
| Assists | 14 | 24 |
| Steals | 5 | 4 |
| Blocks | 2 | 3 |
| Total Turnovers | 6 | 10 |
| Points Conceded Off Turnovers | 12 | 2 |
| Fast Break Points | 3 | 9 |
| Points in Paint | 48 | 44 |
| Fouls | 19 | 24 |
| Technical Fouls | 0 | 0 |
| Flagrant Fouls | 0 | 0 |
| Largest Lead | 19 | 6 |
Matchups
2025-26 Standings
Western Conference
| Pacific | W | L | PCT | GB | STRK |
|---|---|---|---|---|---|
| LA Lakers | 53 | 29 | .646 | - | W3 |
| Phoenix | 45 | 37 | .549 | 8 | W1 |
| LA Clippers | 42 | 40 | .512 | 11 | W1 |
| Golden State | 37 | 45 | .451 | 16 | L3 |
| Sacramento | 22 | 60 | .268 | 31 | L1 |
| Northwest | W | L | PCT | GB | STRK |
|---|---|---|---|---|---|
| Oklahoma City | 64 | 18 | .780 | - | L2 |
| Denver | 54 | 28 | .659 | 10 | W12 |
| Minnesota | 49 | 33 | .598 | 15 | W2 |
| Portland | 42 | 40 | .512 | 22 | W2 |
| Utah | 22 | 60 | .268 | 42 | L1 |
NBA News
LA Clippers vs. Utah Jazz: Game Highlights
LA Clippers vs. Utah Jazz: Game Highlights
9h
San Antonio Spurs vs. Milwaukee Bucks: Game Highlights
San Antonio Spurs vs. Milwaukee Bucks: Game Highlights
9h
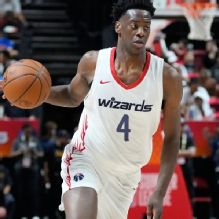
Dybantsa leads Wizards to win in potential summer swan song
In what could be his last game of summer league, No. 1 pick AJ Dybantsa scored 23 points to go along with seven rebounds, helping the Washington Wizards remain undefeated with a 104-85 victory over the Sacramento Kings on Sunday night in Las Vegas.
8h