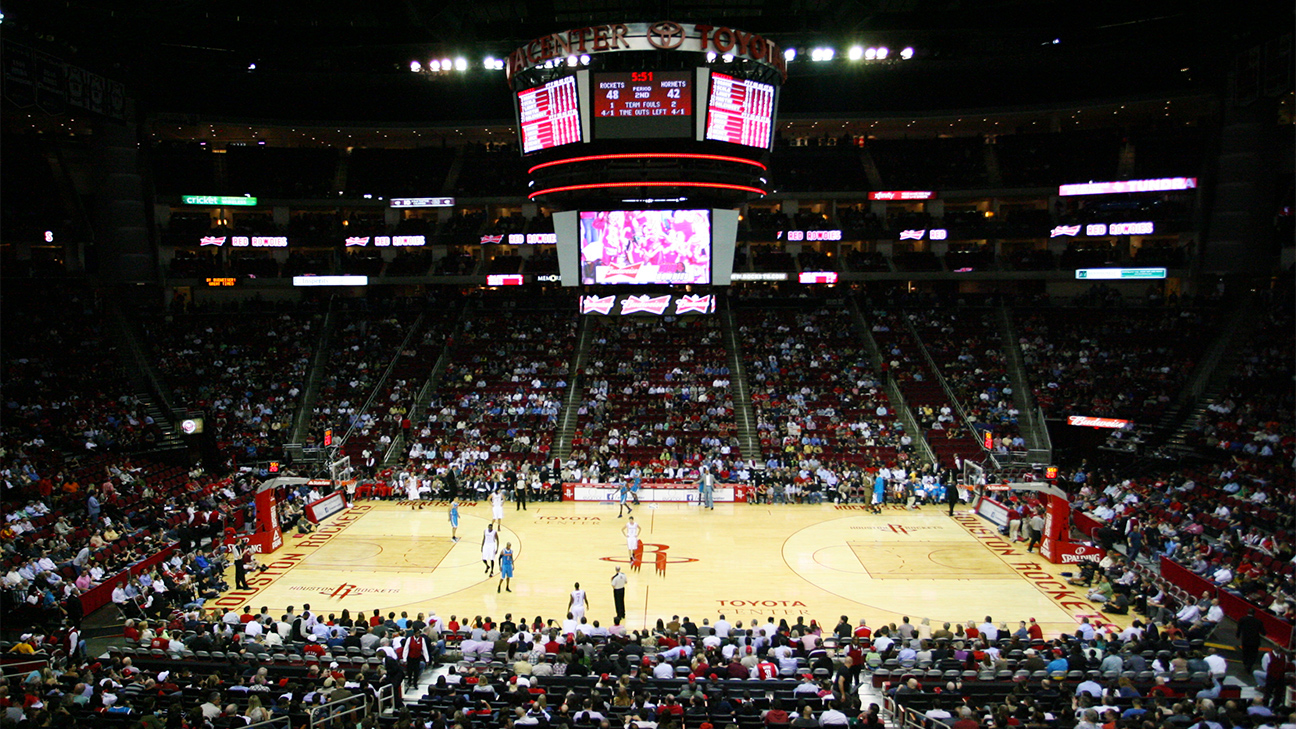
New Orleans Hornets @ Houston Rockets
Game Leaders
Team Stats
48% (39-82)
Field Goal %
44% (37-84)
36% (4-11)
Three Point %
37% (7-19)
90% (28-31)
Free Throw %
77% (24-31)
38
Turnovers
30
50
Rebounds
50
5
Largest Lead
16
Game Information
Houston, TX

Referee:Jason Phillips
Referee:Mike Callahan
Referee:Derek Richardson

Team Stats
| FG | 39-82 | 37-84 |
| Field Goal % | 48 | 44 |
| 3PT | 4-11 | 7-19 |
| Three Point % | 36 | 37 |
| FT | 28-31 | 24-31 |
| Free Throw % | 90 | 77 |
| Rebounds | 50 | 50 |
| Offensive Rebounds | 13 | 11 |
| Defensive Rebounds | 35 | 30 |
| Assists | 19 | 14 |
| Steals | 9 | 9 |
| Blocks | 3 | 3 |
| Total Turnovers | 38 | 30 |
| Points Conceded Off Turnovers | 16 | 24 |
| Fast Break Points | 13 | 20 |
| Points in Paint | 48 | 36 |
| Fouls | 27 | 24 |
| Technical Fouls | 0 | 0 |
| Flagrant Fouls | 0 | 0 |
| Largest Lead | 5 | 16 |
Matchups
2025-26 Standings
Western Conference
| Southwest | W | L | PCT | GB | STRK |
|---|---|---|---|---|---|
| San Antonio | 38 | 16 | .704 | - | W6 |
| Houston | 33 | 20 | .623 | 4.5 | L1 |
| Memphis | 20 | 33 | .377 | 17.5 | L4 |
| Dallas | 19 | 34 | .358 | 18.5 | L8 |
| New Orleans | 15 | 41 | .268 | 24 | L1 |
NBA News

Shams: NBA expected to make decision on expansion later this year
Shams Charania joins "NBA Today" and elaborates on his reporting about the potential upcoming NBA expansion.
2h

Will Jaren Jackson Jr. be ready for the start of next season?
Tim MacMahon reports on the Jazz's Jaren Jackson Jr.'s season-ending surgery.
2h

Suns' Dillon Brooks gets 1-game ban after 16th technical foul
Suns forward Dillon Brooks has been suspended one game after receiving his 16th technical foul of the season. He will sit out against the Spurs on Feb. 19.
3h
GAMBLING PROBLEM? CALL 1-800-GAMBLER, (800) 327-5050 or visit gamblinghelplinema.org (MA). Call 877-8-HOPENY/text HOPENY (467369) (NY). Please Gamble Responsibly. 888-789-7777/visit ccpg.org (CT), or visit www.mdgamblinghelp.org (MD). 21+ and present in most states. (18+ DC/KY/NH/WY). Void in ONT/OR/NH. Eligibility restrictions apply. On behalf of Boot Hill Casino & Resort (KS). Terms: sportsbook.draftkings.com/promos.
Copyright: © 2026 ESPN Enterprises, Inc. All rights reserved.


