
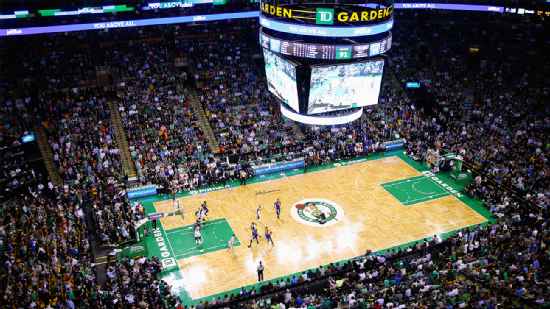
Utah Jazz @ Boston Celtics

27-16, 12-9 Away
86
27-16, 12-9 Away

33-9, 21-3 Home
110
33-9, 21-3 Home
Game Leaders


Team Stats


40% (28-70)
Field Goal %
55% (37-67)
31% (4-13)
Three Point %
43% (9-21)
76% (26-34)
Free Throw %
87% (27-31)
21
Turnovers
17
43
Rebounds
41
0
Largest Lead
25
Game Information
Boston, MA
Referee:Leroy Richardson
Referee:Zach Zarba
Referee:Ken Mauer
Team Stats
 | | |
|---|---|---|
| FG | 28-70 | 37-67 |
| Field Goal % | 40 | 55 |
| 3PT | 4-13 | 9-21 |
| Three Point % | 31 | 43 |
| FT | 26-34 | 27-31 |
| Free Throw % | 76 | 87 |
| Rebounds | 43 | 41 |
| Offensive Rebounds | 12 | 7 |
| Defensive Rebounds | 22 | 27 |
| Assists | 19 | 31 |
| Steals | 6 | 15 |
| Blocks | 6 | 5 |
| Total Turnovers | 21 | 17 |
| Points Conceded Off Turnovers | 17 | 26 |
| Fast Break Points | 17 | 17 |
| Points in Paint | 32 | 44 |
| Fouls | 28 | 30 |
| Technical Fouls | 1 | 3 |
| Flagrant Fouls | 0 | 0 |
| Largest Lead | 0 | 25 |
Matchups
2025-26 Standings
Western Conference
| Northwest | W | L | PCT | GB | STRK |
|---|---|---|---|---|---|
| Oklahoma City | 64 | 18 | .780 | - | L2 |
| Denver | 54 | 28 | .659 | 10 | W12 |
| Minnesota | 49 | 33 | .598 | 15 | W2 |
| Portland | 42 | 40 | .512 | 22 | W2 |
| Utah | 22 | 60 | .268 | 42 | L1 |
Eastern Conference
| Atlantic | W | L | PCT | GB | STRK |
|---|---|---|---|---|---|
| Boston | 56 | 26 | .683 | - | W2 |
| New York | 53 | 29 | .646 | 3 | L1 |
| Toronto | 46 | 36 | .561 | 10 | W1 |
| Philadelphia | 45 | 37 | .549 | 11 | W2 |
| Brooklyn | 20 | 62 | .244 | 36 | L3 |
NBA News
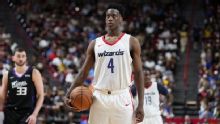
How Dybantsa, Young and Davis have the Wizards thinking playoffs
Will the trio be the difference that takes Washington from last place in the East to a competitive contender?
3h
Washington Wizards vs. LA Clippers: Game Highlights
Washington Wizards vs. LA Clippers: Game Highlights
10h
Utah Jazz vs. San Antonio Spurs: Game Highlights
Utah Jazz vs. San Antonio Spurs: Game Highlights
11h