
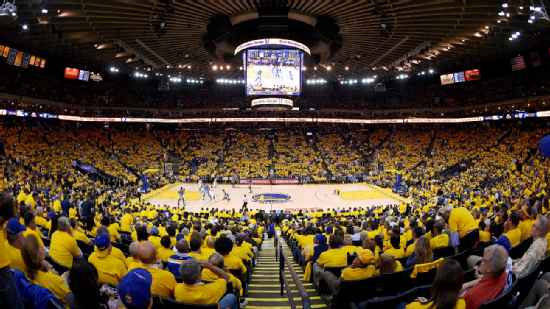
New Orleans Hornets @ Golden State Warriors

31-16, 12-11 Away
112
31-16, 12-11 Away

19-26, 13-9 Home
103
19-26, 13-9 Home
Game Leaders


Team Stats


62% (46-74)
Field Goal %
51% (38-75)
38% (5-13)
Three Point %
31% (4-13)
79% (15-19)
Free Throw %
88% (23-26)
23
Turnovers
21
41
Rebounds
31
25
Largest Lead
2
Game Information
Oakland, CA
Referee:Leroy Richardson
Referee:Bill Spooner
Referee:Gary Zielinski
Team Stats
 | | |
|---|---|---|
| FG | 46-74 | 38-75 |
| Field Goal % | 62 | 51 |
| 3PT | 5-13 | 4-13 |
| Three Point % | 38 | 31 |
| FT | 15-19 | 23-26 |
| Free Throw % | 79 | 88 |
| Rebounds | 41 | 31 |
| Offensive Rebounds | 7 | 9 |
| Defensive Rebounds | 28 | 19 |
| Assists | 32 | 19 |
| Steals | 9 | 4 |
| Blocks | 6 | 4 |
| Total Turnovers | 23 | 21 |
| Points Conceded Off Turnovers | 30 | 29 |
| Fast Break Points | 35 | 11 |
| Points in Paint | 60 | 40 |
| Fouls | 27 | 17 |
| Technical Fouls | 1 | 2 |
| Flagrant Fouls | 0 | 0 |
| Largest Lead | 25 | 2 |
Matchups
2025-26 Standings
Western Conference
| Pacific | W | L | PCT | GB | STRK |
|---|---|---|---|---|---|
| LA Lakers | 53 | 29 | .646 | - | W3 |
| Phoenix | 45 | 37 | .549 | 8 | W1 |
| LA Clippers | 42 | 40 | .512 | 11 | W1 |
| Golden State | 37 | 45 | .451 | 16 | L3 |
| Sacramento | 22 | 60 | .268 | 31 | L1 |
NBA News
Cam Boozer and Darryn Peterson exchange 3-pointers
Cam Boozer and Darryn Peterson exchange 3-pointers
10h
No. 6 pick Mikel Brown Jr. whips impressive wraparound dime
No. 6 pick Mikel Brown Jr. whips impressive wraparound dime
9h
2026 NBA buzz: Latest free agency and trade updates
We're tracking deals, trades and buzz across the NBA, including the latest free agency signings.
12h