
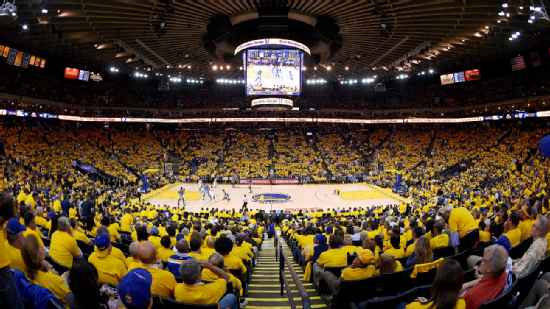
Toronto Raptors @ Golden State Warriors

20-52, 6-30 Away
100
20-52, 6-30 Away

31-42, 22-14 Home
138
31-42, 22-14 Home
Game Leaders


Team Stats


47% (38-81)
Field Goal %
61% (51-83)
46% (6-13)
Three Point %
59% (10-17)
69% (18-26)
Free Throw %
81% (26-32)
18
Turnovers
10
41
Rebounds
48
3
Largest Lead
47
Game Information
Oakland, CA
Referee:Derrick Collins
Referee:Violet Palmer
Referee:Ed Malloy
Team Stats
 | | |
|---|---|---|
| FG | 38-81 | 51-83 |
| Field Goal % | 47 | 61 |
| 3PT | 6-13 | 10-17 |
| Three Point % | 46 | 59 |
| FT | 18-26 | 26-32 |
| Free Throw % | 69 | 81 |
| Rebounds | 41 | 48 |
| Offensive Rebounds | 10 | 7 |
| Defensive Rebounds | 24 | 33 |
| Assists | 26 | 33 |
| Steals | 6 | 12 |
| Blocks | 4 | 5 |
| Total Turnovers | 18 | 10 |
| Points Conceded Off Turnovers | 11 | 34 |
| Fast Break Points | 15 | 40 |
| Points in Paint | 52 | 58 |
| Fouls | 20 | 22 |
| Technical Fouls | 1 | 1 |
| Flagrant Fouls | 0 | 0 |
| Largest Lead | 3 | 47 |
Matchups
2025-26 Standings
Eastern Conference
| Atlantic | W | L | PCT | GB | STRK |
|---|---|---|---|---|---|
| Boston | 56 | 26 | .683 | - | W2 |
| New York | 53 | 29 | .646 | 3 | L1 |
| Toronto | 46 | 36 | .561 | 10 | W1 |
| Philadelphia | 45 | 37 | .549 | 11 | W2 |
| Brooklyn | 20 | 62 | .244 | 36 | L3 |
Western Conference
| Pacific | W | L | PCT | GB | STRK |
|---|---|---|---|---|---|
| LA Lakers | 53 | 29 | .646 | - | W3 |
| Phoenix | 45 | 37 | .549 | 8 | W1 |
| LA Clippers | 42 | 40 | .512 | 11 | W1 |
| Golden State | 37 | 45 | .451 | 16 | L3 |
| Sacramento | 22 | 60 | .268 | 31 | L1 |
NBA News

Darryn Peterson, Cameron Boozer strong in summer league debuts
Darryn Peterson and Cameron Boozer had strong summer league debuts, scoring 28 and 15 points, respectively.
13h

Sources: Patrick Ewing joins Keefe's Wizards staff as assistant
Georgetown and Knicks legend Patrick Ewing has agreed to become an assistant coach for the Wizards and head coach Brian Keefe, sources told ESPN.
2h
2026 NBA buzz: Latest free agency and trade updates
We're tracking deals, trades and buzz across the NBA, including the latest on LeBron's next move.
13h