
New Jersey Nets @ Philadelphia 76ers

23-52, 5-33 Away
90
23-52, 5-33 Away

40-36, 25-12 Home
115
40-36, 25-12 Home
Game Leaders


Team Stats


44% (37-85)
Field Goal %
56% (45-80)
25% (3-12)
Three Point %
43% (6-14)
65% (13-20)
Free Throw %
86% (19-22)
10
Turnovers
9
40
Rebounds
53
0
Largest Lead
35
Game Information
Philadelphia, PA

Referee:Leroy Richardson
Referee:Mark Ayotte
Referee:Greg Willard
Team Stats
 | | |
|---|---|---|
| FG | 37-85 | 45-80 |
| Field Goal % | 44 | 56 |
| 3PT | 3-12 | 6-14 |
| Three Point % | 25 | 43 |
| FT | 13-20 | 19-22 |
| Free Throw % | 65 | 86 |
| Rebounds | 40 | 53 |
| Offensive Rebounds | 13 | 9 |
| Defensive Rebounds | 22 | 34 |
| Assists | 23 | 25 |
| Steals | 8 | 4 |
| Blocks | 2 | 4 |
| Total Turnovers | 10 | 9 |
| Points Conceded Off Turnovers | 12 | 14 |
| Fast Break Points | 13 | 20 |
| Points in Paint | 40 | 46 |
| Fouls | 17 | 15 |
| Technical Fouls | 0 | 1 |
| Flagrant Fouls | 0 | 0 |
| Largest Lead | 0 | 35 |
Matchups
2025-26 Standings
Eastern Conference
| Atlantic | W | L | PCT | GB | STRK |
|---|---|---|---|---|---|
| Boston | 56 | 26 | .683 | - | W2 |
| New York | 53 | 29 | .646 | 3 | L1 |
| Toronto | 46 | 36 | .561 | 10 | W1 |
| Philadelphia | 45 | 37 | .549 | 11 | W2 |
| Brooklyn | 20 | 62 | .244 | 36 | L3 |
NBA News
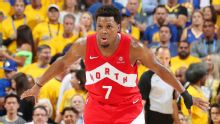
Kyle Lowry retires after signing one-day contract with Raptors
Six-time All-Star Kyle Lowry has retired after signing a one-day contract with the Toronto Raptors, where he spent nine of his 20 NBA seasons and won an NBA championship
1h

Chris Canty puzzled over why Donovan Mitchell has signed contract now
Chris Canty puzzled over why Donovan Mitchell has signed contract now
1h

Cohen: Celtics trading Jaylen Brown for one player was 'beyond stupid'
Cohen: Celtics trading Jaylen Brown for one player was 'beyond stupid'
1h