
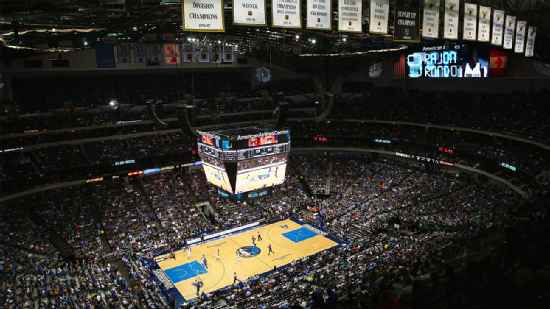
Miami Heat @ Dallas Mavericks
NBA FINALS - GAME 3 • MIA leads series 2-1

58-24, 28-13 Away
88
58-24, 28-13 Away

57-25, 29-12 Home
86
57-25, 29-12 Home
Game Leaders


Team Stats


44% (34-78)
Field Goal %
40% (28-70)
42% (8-19)
Three Point %
38% (8-21)
80% (12-15)
Free Throw %
81% (22-27)
13
Turnovers
14
47
Rebounds
47
14
Largest Lead
5
Game Information
Dallas, TX
Team Stats
 | | |
|---|---|---|
| FG | 34-78 | 28-70 |
| Field Goal % | 44 | 40 |
| 3PT | 8-19 | 8-21 |
| Three Point % | 42 | 38 |
| FT | 12-15 | 22-27 |
| Free Throw % | 80 | 81 |
| Rebounds | 47 | 47 |
| Offensive Rebounds | 9 | 12 |
| Defensive Rebounds | 27 | 30 |
| Assists | 20 | 18 |
| Steals | 8 | 3 |
| Blocks | 5 | 8 |
| Total Turnovers | 13 | 14 |
| Points Conceded Off Turnovers | 19 | 15 |
| Fast Break Points | 14 | 16 |
| Points in Paint | 40 | 22 |
| Fouls | 27 | 14 |
| Technical Fouls | 0 | 0 |
| Flagrant Fouls | 0 | 0 |
| Largest Lead | 14 | 5 |
Matchups
2025-26 Standings
Eastern Conference
| Southeast | W | L | PCT | GB | STRK |
|---|---|---|---|---|---|
| Atlanta | 46 | 36 | .561 | - | L1 |
| Orlando | 45 | 37 | .549 | 1 | L1 |
| Charlotte | 44 | 38 | .537 | 2 | W1 |
| Miami | 43 | 39 | .524 | 3 | W2 |
| Washington | 17 | 65 | .207 | 29 | L10 |
Western Conference
| Southwest | W | L | PCT | GB | STRK |
|---|---|---|---|---|---|
| San Antonio | 62 | 20 | .756 | - | L1 |
| Houston | 52 | 30 | .634 | 10 | W1 |
| New Orleans | 26 | 56 | .317 | 36 | L2 |
| Dallas | 26 | 56 | .317 | 36 | W1 |
| Memphis | 25 | 57 | .305 | 37 | L8 |
NBA News

Washington Wizards vs. LA Clippers: Game Highlights
Washington Wizards vs. LA Clippers: Game Highlights
3h

Utah Jazz vs. San Antonio Spurs: Game Highlights
Utah Jazz vs. San Antonio Spurs: Game Highlights
4h

Boston Celtics vs. Sacramento Kings: Game Highlights
Boston Celtics vs. Sacramento Kings: Game Highlights
4h