
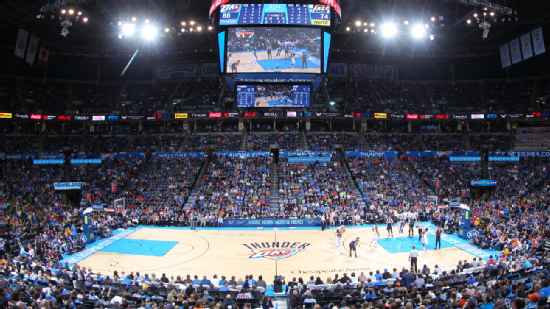
Dallas Mavericks @ Oklahoma City Thunder

0-3, 0-1 Away
102
0-3, 0-1 Away

4-0, 2-0 Home
104
4-0, 2-0 Home
Game Leaders


Team Stats


42% (38-90)
Field Goal %
59% (37-63)
35% (9-26)
Three Point %
43% (6-14)
81% (17-21)
Free Throw %
75% (24-32)
12
Turnovers
26
45
Rebounds
45
12
Largest Lead
8
Game Information
Oklahoma City, OK
Referee:Joe Crawford
Referee:Scott Wall
Referee:Zach Zarba
Team Stats
 | | |
|---|---|---|
| FG | 38-90 | 37-63 |
| Field Goal % | 42 | 59 |
| 3PT | 9-26 | 6-14 |
| Three Point % | 35 | 43 |
| FT | 17-21 | 24-32 |
| Free Throw % | 81 | 75 |
| Rebounds | 45 | 45 |
| Offensive Rebounds | 14 | 6 |
| Defensive Rebounds | 24 | 32 |
| Assists | 25 | 19 |
| Steals | 14 | 8 |
| Blocks | 1 | 8 |
| Total Turnovers | 12 | 26 |
| Points Conceded Off Turnovers | 33 | 11 |
| Fast Break Points | 10 | 17 |
| Points in Paint | 36 | 36 |
| Fouls | 24 | 19 |
| Technical Fouls | 4 | 2 |
| Flagrant Fouls | 0 | 0 |
| Largest Lead | 12 | 8 |
Matchups
2025-26 Standings
Western Conference
| Southwest | W | L | PCT | GB | STRK |
|---|---|---|---|---|---|
| San Antonio | 62 | 20 | .756 | - | L1 |
| Houston | 52 | 30 | .634 | 10 | W1 |
| New Orleans | 26 | 56 | .317 | 36 | L2 |
| Dallas | 26 | 56 | .317 | 36 | W1 |
| Memphis | 25 | 57 | .305 | 37 | L8 |
| Northwest | W | L | PCT | GB | STRK |
|---|---|---|---|---|---|
| Oklahoma City | 64 | 18 | .780 | - | L2 |
| Denver | 54 | 28 | .659 | 10 | W12 |
| Minnesota | 49 | 33 | .598 | 15 | W2 |
| Portland | 42 | 40 | .512 | 22 | W2 |
| Utah | 22 | 60 | .268 | 42 | L1 |
NBA News
Cam Boozer and Darryn Peterson exchange 3-pointers
Cam Boozer and Darryn Peterson exchange 3-pointers
3h
No. 6 pick Mikel Brown Jr. whips impressive wraparound dime
No. 6 pick Mikel Brown Jr. whips impressive wraparound dime
2h
2026 NBA buzz: Latest free agency and trade updates
We're tracking deals, trades and buzz across the NBA, including the latest free agency signings.
5h