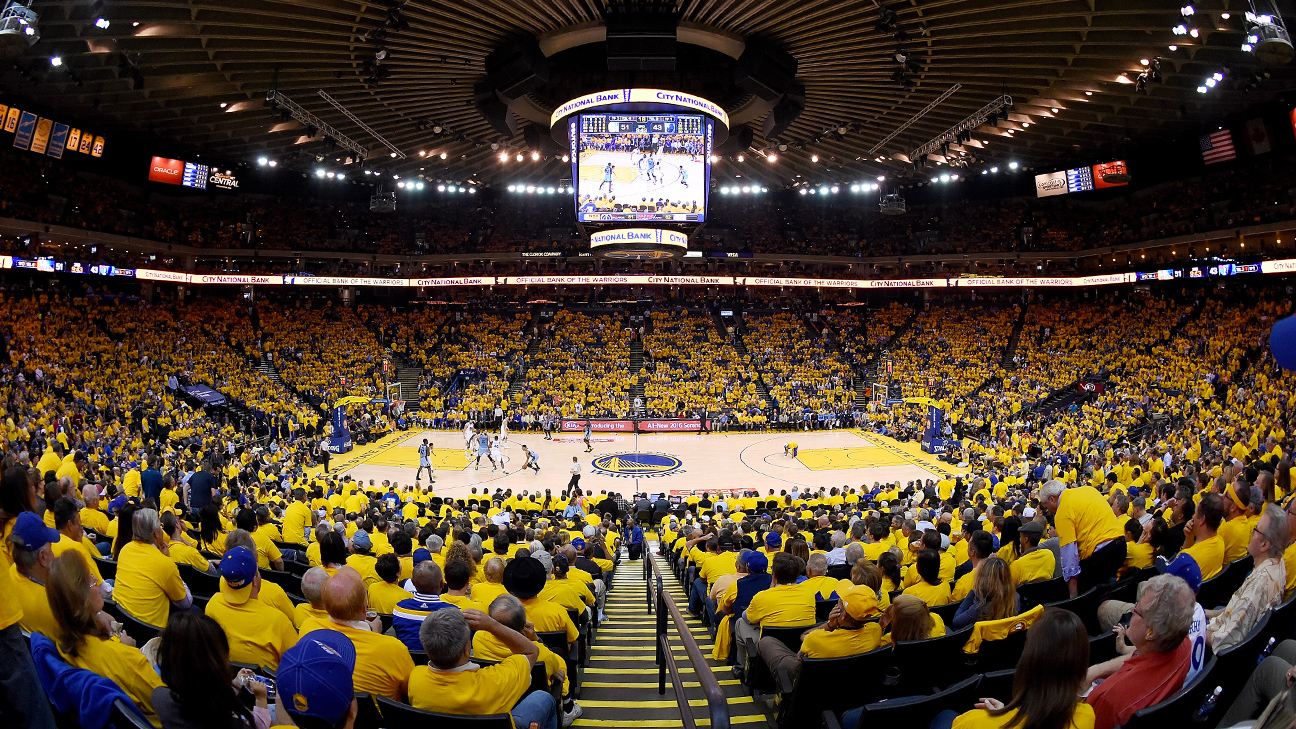
Denver Nuggets @ Golden State Warriors
Game Leaders
Team Stats
46% (37-80)
Field Goal %
52% (46-88)
32% (8-25)
Three Point %
38% (8-21)
75% (15-20)
Free Throw %
75% (12-16)
32
Turnovers
26
46
Rebounds
48
5
Largest Lead
18
Game Information
Oakland, CA

Referee:Matt Boland
Referee:Curtis Blair
Referee:Derrick Stafford

Team Stats
| FG | 37-80 | 46-88 |
| Field Goal % | 46 | 52 |
| 3PT | 8-25 | 8-21 |
| Three Point % | 32 | 38 |
| FT | 15-20 | 12-16 |
| Free Throw % | 75 | 75 |
| Rebounds | 46 | 48 |
| Offensive Rebounds | 11 | 14 |
| Defensive Rebounds | 24 | 27 |
| Assists | 22 | 25 |
| Steals | 6 | 9 |
| Blocks | 6 | 8 |
| Total Turnovers | 32 | 26 |
| Points Conceded Off Turnovers | 20 | 20 |
| Fast Break Points | 10 | 25 |
| Points in Paint | 48 | 58 |
| Fouls | 15 | 19 |
| Technical Fouls | 1 | 0 |
| Flagrant Fouls | 0 | 0 |
| Largest Lead | 5 | 18 |
Matchups
2025-26 Standings
Western Conference
| Northwest | W | L | PCT | GB | STRK |
|---|---|---|---|---|---|
| Oklahoma City | 40 | 12 | .769 | - | L1 |
| Denver | 33 | 19 | .635 | 7 | L3 |
| Minnesota | 32 | 20 | .615 | 8 | W1 |
| Portland | 23 | 28 | .451 | 16.5 | L6 |
| Utah | 16 | 35 | .314 | 23.5 | W1 |
| Pacific | W | L | PCT | GB | STRK |
|---|---|---|---|---|---|
| LA Lakers | 30 | 19 | .612 | - | W1 |
| Phoenix | 31 | 20 | .608 | - | W1 |
| Golden State | 27 | 24 | .529 | 4 | L2 |
| LA Clippers | 23 | 27 | .460 | 7.5 | L2 |
| Sacramento | 12 | 40 | .231 | 19.5 | L10 |
NBA News

NBA trade deadline: Reactions and grades for every transaction
Kevin Pelton grades every deal on deadline day, including big moves by the Pacers, Lakers, Wolves and Warriors.
2h

NBA buzz: All the moves that did and didn't happen on deadline day
The 3 p.m. ET trade deadline has come and gone, and Giannis is still in Milwaukee. Catch up on everything that went down.
3h

NBA trade deadline: What's next for Giannis, LeBron? Biggest questions
NBA insiders weigh in on nine pressing questions coming out of the 2026 trade deadline.
3h
GAMBLING PROBLEM? CALL 1-800-GAMBLER, (800) 327-5050 or visit gamblinghelplinema.org (MA). Call 877-8-HOPENY/text HOPENY (467369) (NY). Please Gamble Responsibly. 888-789-7777/visit ccpg.org (CT), or visit www.mdgamblinghelp.org (MD). 21+ and present in most states. (18+ DC/KY/NH/WY). Void in ONT/OR/NH. Eligibility restrictions apply. On behalf of Boot Hill Casino & Resort (KS). Terms: sportsbook.draftkings.com/promos.
Copyright: © 2026 ESPN Enterprises, Inc. All rights reserved.


