
Denver Nuggets @ Golden State Warriors

8-8, 4-7 Away
105
8-8, 4-7 Away

9-6, 5-2 Home
106
9-6, 5-2 Home
Game Leaders


Team Stats


45% (38-84)
Field Goal %
51% (44-86)
48% (10-21)
Three Point %
44% (8-18)
79% (19-24)
Free Throw %
77% (10-13)
15
Turnovers
16
48
Rebounds
48
Game Information
Oakland, CA
Referee:Ron Garretson
Referee:John Goble
Referee:Brent Barnaky
Team Stats
 | | |
|---|---|---|
| FG | 38-84 | 44-86 |
| Field Goal % | 45 | 51 |
| 3PT | 10-21 | 8-18 |
| Three Point % | 48 | 44 |
| FT | 19-24 | 10-13 |
| Free Throw % | 79 | 77 |
| Rebounds | 48 | 48 |
| Offensive Rebounds | 10 | 9 |
| Defensive Rebounds | 30 | 34 |
| Assists | 25 | 29 |
| Steals | 9 | 10 |
| Blocks | 7 | 5 |
| Total Turnovers | 15 | 16 |
| Points Conceded Off Turnovers | 14 | 10 |
| Fast Break Points | 23 | 14 |
| Points in Paint | 44 | 36 |
| Fouls | 16 | 22 |
| Technical Fouls | 1 | 0 |
| Flagrant Fouls | 0 | 0 |
Matchups
2025-26 Standings
Western Conference
| Northwest | W | L | PCT | GB | STRK |
|---|---|---|---|---|---|
| Oklahoma City | 64 | 18 | .780 | - | L2 |
| Denver | 54 | 28 | .659 | 10 | W12 |
| Minnesota | 49 | 33 | .598 | 15 | W2 |
| Portland | 42 | 40 | .512 | 22 | W2 |
| Utah | 22 | 60 | .268 | 42 | L1 |
| Pacific | W | L | PCT | GB | STRK |
|---|---|---|---|---|---|
| LA Lakers | 53 | 29 | .646 | - | W3 |
| Phoenix | 45 | 37 | .549 | 8 | W1 |
| LA Clippers | 42 | 40 | .512 | 11 | W1 |
| Golden State | 37 | 45 | .451 | 16 | L3 |
| Sacramento | 22 | 60 | .268 | 31 | L1 |
NBA News

2026 NBA buzz: Latest free agency and trade updates
We're tracking deals, trades and buzz across the NBA, including Donovan Mitchell agreeing to an extension with the Cavs.
3h

Tim Hardaway Jr. excited to follow in his dad's footsteps
Tim Hardaway Jr. excited to follow in his dad's footsteps
4h
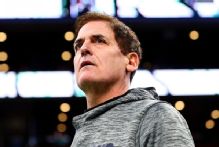
Cuban accuses Mavs owner of freezing him out in proposed move
The Dallas Morning News reported Wednesday that Mark Cuban alleges Mavericks governor Patrick Dumont has engaged in "adversarial business practices" in a proposed move of the club out of downtown.
3h