
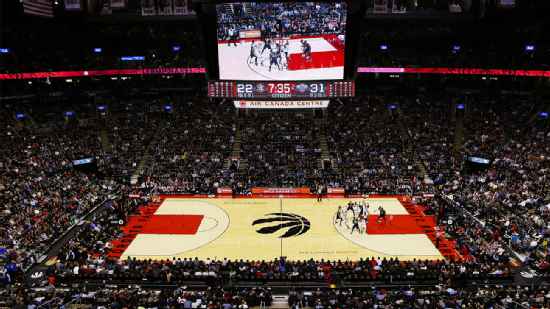
Utah Jazz @ Toronto Raptors

0-7, 0-5 Away
91
0-7, 0-5 Away

3-4, 2-1 Home
115
3-4, 2-1 Home
Game Leaders


Team Stats


44% (34-77)
Field Goal %
48% (40-83)
17% (3-18)
Three Point %
40% (10-25)
83% (20-24)
Free Throw %
86% (25-29)
16
Turnovers
12
44
Rebounds
50
Game Information
Toronto, ON
Referee:Michael Smith
Referee:Sean Corbin
Referee:Eddie F. Rush
Team Stats
 | | |
|---|---|---|
| FG | 34-77 | 40-83 |
| Field Goal % | 44 | 48 |
| 3PT | 3-18 | 10-25 |
| Three Point % | 17 | 40 |
| FT | 20-24 | 25-29 |
| Free Throw % | 83 | 86 |
| Rebounds | 44 | 50 |
| Offensive Rebounds | 12 | 13 |
| Defensive Rebounds | 25 | 27 |
| Assists | 20 | 23 |
| Steals | 7 | 8 |
| Blocks | 5 | 4 |
| Total Turnovers | 16 | 12 |
| Points Conceded Off Turnovers | 22 | 13 |
| Fast Break Points | 10 | 15 |
| Points in Paint | 44 | 46 |
| Fouls | 24 | 20 |
| Technical Fouls | 1 | 0 |
| Flagrant Fouls | 0 | 0 |
Matchups
2025-26 Standings
Western Conference
| Northwest | W | L | PCT | GB | STRK |
|---|---|---|---|---|---|
| Oklahoma City | 64 | 18 | .780 | - | L2 |
| Denver | 54 | 28 | .659 | 10 | W12 |
| Minnesota | 49 | 33 | .598 | 15 | W2 |
| Portland | 42 | 40 | .512 | 22 | W2 |
| Utah | 22 | 60 | .268 | 42 | L1 |
Eastern Conference
| Atlantic | W | L | PCT | GB | STRK |
|---|---|---|---|---|---|
| Boston | 56 | 26 | .683 | - | W2 |
| New York | 53 | 29 | .646 | 3 | L1 |
| Toronto | 46 | 36 | .561 | 10 | W1 |
| Philadelphia | 45 | 37 | .549 | 11 | W2 |
| Brooklyn | 20 | 62 | .244 | 36 | L3 |
NBA News
Teams sending recruiting voice notes to LeBron James via Rich Paul
As LeBron James' free agency decision stretches into its second week, some teams interested in him joining them have had an opportunity to pitch the four-time champion indirectly.
1h
Steph Curry acknowledges appeal of playing with LeBron James
Stephen Curry acknowledged the appeal of a late-career Hall of Fame team-up with his longtime NBA rival LeBron James.
1h

Breaking down Marcus Spears Jr.'s reclassification, commitment, NBA future
The former No. 1 recruit joins a loaded Texas roster. How does he fit, and what does his reclassification mean for his NBA potential?
1h