
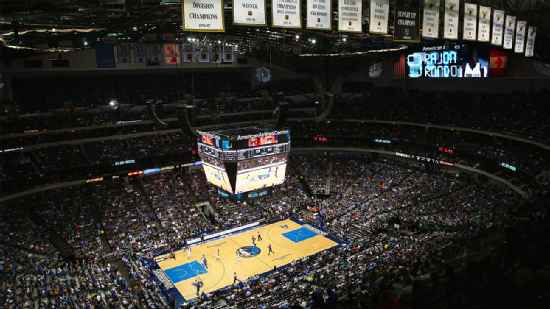
San Antonio Spurs @ Dallas Mavericks

42-8, 15-8 Away
116
42-8, 15-8 Away

28-25, 15-10 Home
90
28-25, 15-10 Home
Game Leaders


Team Stats


51% (41-80)
Field Goal %
45% (33-73)
55% (12-22)
Three Point %
20% (3-15)
88% (22-25)
Free Throw %
78% (21-27)
14
Turnovers
15
48
Rebounds
40
39
Largest Lead
2
Game Information
Dallas, TX
Referee:Josh Tiven
Referee:Mike Callahan
Referee:Karl Lane
Team Stats
 | | |
|---|---|---|
| FG | 41-80 | 33-73 |
| Field Goal % | 51 | 45 |
| 3PT | 12-22 | 3-15 |
| Three Point % | 55 | 20 |
| FT | 22-25 | 21-27 |
| Free Throw % | 88 | 78 |
| Rebounds | 48 | 40 |
| Offensive Rebounds | 8 | 5 |
| Defensive Rebounds | 34 | 31 |
| Assists | 19 | 17 |
| Steals | 6 | 7 |
| Blocks | 4 | 2 |
| Total Turnovers | 14 | 15 |
| Points Conceded Off Turnovers | 11 | 16 |
| Fast Break Points | 4 | 22 |
| Points in Paint | 30 | 48 |
| Fouls | 23 | 23 |
| Technical Fouls | 1 | 3 |
| Flagrant Fouls | 0 | 1 |
| Largest Lead | 39 | 2 |
Matchups
2025-26 Standings
Western Conference
| Southwest | W | L | PCT | GB | STRK |
|---|---|---|---|---|---|
| San Antonio | 62 | 20 | .756 | - | L1 |
| Houston | 52 | 30 | .634 | 10 | W1 |
| New Orleans | 26 | 56 | .317 | 36 | L2 |
| Dallas | 26 | 56 | .317 | 36 | W1 |
| Memphis | 25 | 57 | .305 | 37 | L8 |
NBA News
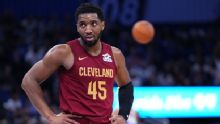
2026 NBA buzz: Latest free agency and trade updates
We're tracking deals, trades and buzz across the NBA, including Donovan Mitchell agreeing to an extension with the Cavs.
5h

2026 NBA free agency: Grades for offseason signings, extensions
We're grading the biggest free agent signings and extensions, including the Cavaliers signing Mitchell to a nearly $275M deal.
5h
Kyle Lowry retires after signing one-day contract with Raptors
Six-time All-Star Kyle Lowry has retired after signing a one-day contract with the Toronto Raptors, where he spent nine of his 20 NBA seasons and won an NBA championship
5h