
Detroit Pistons @ Philadelphia 76ers
Series tied 2-2

50-32, 20-21 Away
82
50-32, 20-21 Away

48-34, 25-16 Home
95
48-34, 25-16 Home
Game Leaders


Team Stats


43% (29-68)
Field Goal %
52% (37-71)
29% (6-21)
Three Point %
25% (2-8)
78% (18-23)
Free Throw %
70% (19-27)
38
Turnovers
16
44
Rebounds
42
Game Information
Philadelphia, PA

Referee:Dick Bavetta
Referee:Greg Willard
Referee:Bernie Fryer
Team Stats
 | | |
|---|---|---|
| FG | 29-68 | 37-71 |
| Field Goal % | 43 | 52 |
| 3PT | 6-21 | 2-8 |
| Three Point % | 29 | 25 |
| FT | 18-23 | 19-27 |
| Free Throw % | 78 | 70 |
| Rebounds | 44 | 42 |
| Offensive Rebounds | 10 | 5 |
| Defensive Rebounds | 27 | 29 |
| Assists | 20 | 21 |
| Steals | 4 | 13 |
| Blocks | 2 | 4 |
| Total Turnovers | 38 | 16 |
| Points Conceded Off Turnovers | 10 | 22 |
| Fast Break Points | 2 | 4 |
| Points in Paint | -1 | -1 |
| Fouls | 23 | 22 |
| Technical Fouls | 0 | 1 |
| Flagrant Fouls | 0 | 0 |
Matchups
2025-26 Standings
NBA News
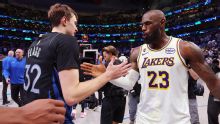
Los Angeles Lakers vs. Dallas Mavericks: Game Highlights
Los Angeles Lakers vs. Dallas Mavericks: Game Highlights
13m
Cooper Flagg scores 45 points and Mavs beat LeBron James and injury-depleted Lakers 134-128
— Cooper Flagg scored 45 points and the Dallas Mavericks ended their longest home losing streak in 32 years at 14 games with a 134-128 victory over the
24m
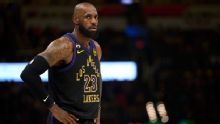
Bucks reference LeBron James' Milwaukee, Memphis comments after win
The Los Angeles Lakers star said Saturday that the two cities he doesn't like playing in right now are Milwaukee and Memphis.
24m