
Chicago Bulls @ Los Angeles Lakers

7-5, 2-4 Away
91
7-5, 2-4 Away

13-2, 8-1 Home
98
13-2, 8-1 Home
Game Leaders


Team Stats


40% (34-86)
Field Goal %
40% (32-81)
20% (4-20)
Three Point %
40% (10-25)
73% (19-26)
Free Throw %
89% (24-27)
26
Turnovers
24
58
Rebounds
53
5
Largest Lead
13
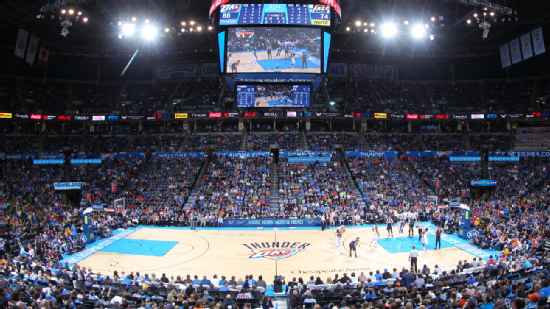
Game Information
Oklahoma City, OK
Team Stats
 | | |
|---|---|---|
| FG | 34-86 | 32-81 |
| Field Goal % | 40 | 40 |
| 3PT | 4-20 | 10-25 |
| Three Point % | 20 | 40 |
| FT | 19-26 | 24-27 |
| Free Throw % | 73 | 89 |
| Rebounds | 58 | 53 |
| Offensive Rebounds | 14 | 10 |
| Defensive Rebounds | 32 | 28 |
| Assists | 20 | 19 |
| Steals | 11 | 9 |
| Blocks | 7 | 9 |
| Total Turnovers | 26 | 24 |
| Points Conceded Off Turnovers | 9 | 17 |
| Fast Break Points | 9 | 13 |
| Points in Paint | 42 | 36 |
| Fouls | 19 | 18 |
| Technical Fouls | 0 | 0 |
| Flagrant Fouls | 0 | 0 |
| Largest Lead | 5 | 13 |
Matchups
2025-26 Standings
Western Conference
| Pacific | W | L | PCT | GB | STRK |
|---|---|---|---|---|---|
| LA Lakers | 33 | 21 | .611 | - | W1 |
| Phoenix | 32 | 23 | .582 | 1.5 | L1 |
| Golden State | 29 | 26 | .527 | 4.5 | L1 |
| LA Clippers | 26 | 28 | .481 | 7 | W1 |
| Sacramento | 12 | 44 | .214 | 22 | L14 |
NBA News
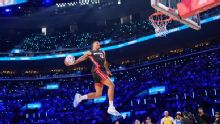
2026 NBA All-Star Weekend takeaways: Dunks, stars and more
Our experts break down what to watch over the 2026 NBA All-Star Weekend and their picks for contests, competitions and more.
3h
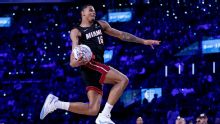
NBA All-Star 2026: Live updates, highlights through the weekend
All of the live updates, top moments and results from NBA All-Star Weekend in Inglewood, California.
3h
Adam Silver 'paying attention' to tanking teams
NBA commissioner Adam Silver addresses the tanking issue in the NBA.
4h