
San Antonio Spurs @ Minnesota Timberwolves

32-6, 12-4 Away
107
32-6, 12-4 Away
Final
| 1 | 2 | 3 | 4 | T | |
|---|---|---|---|---|---|
SA | 36 | 27 | 25 | 19 | 107 |
MIN | 25 | 28 | 23 | 20 | 96 |

9-30, 7-11 Home
96
9-30, 7-11 Home
Game Leaders


Team Stats


47% (37-79)
Field Goal %
38% (34-90)
50% (11-22)
Three Point %
35% (8-23)
79% (22-28)
Free Throw %
83% (20-24)
34
Turnovers
30
53
Rebounds
55
16
Largest Lead
0
Game Information
Minneapolis, MN
Referee:David Jones
Referee:Ken Mauer
Referee:Brent Barnaky
Team Stats
 | | |
|---|---|---|
| FG | 37-79 | 34-90 |
| Field Goal % | 47 | 38 |
| 3PT | 11-22 | 8-23 |
| Three Point % | 50 | 35 |
| FT | 22-28 | 20-24 |
| Free Throw % | 79 | 83 |
| Rebounds | 53 | 55 |
| Offensive Rebounds | 8 | 14 |
| Defensive Rebounds | 38 | 33 |
| Assists | 28 | 19 |
| Steals | 8 | 13 |
| Blocks | 5 | 2 |
| Total Turnovers | 34 | 30 |
| Points Conceded Off Turnovers | 19 | 25 |
| Fast Break Points | 8 | 10 |
| Points in Paint | 28 | 38 |
| Fouls | 19 | 21 |
| Technical Fouls | 1 | 5 |
| Flagrant Fouls | 0 | 0 |
| Largest Lead | 16 | 0 |
Matchups
2025-26 Standings
Western Conference
| Southwest | W | L | PCT | GB | STRK |
|---|---|---|---|---|---|
| San Antonio | 38 | 16 | .704 | - | W6 |
| Houston | 33 | 20 | .623 | 4.5 | L1 |
| Memphis | 20 | 33 | .377 | 17.5 | L4 |
| Dallas | 19 | 35 | .352 | 19 | L9 |
| New Orleans | 15 | 41 | .268 | 24 | L1 |
| Northwest | W | L | PCT | GB | STRK |
|---|---|---|---|---|---|
| Oklahoma City | 42 | 14 | .750 | - | L1 |
| Denver | 35 | 20 | .636 | 6.5 | W1 |
| Minnesota | 34 | 22 | .607 | 8 | W2 |
| Portland | 27 | 29 | .482 | 15 | W1 |
| Utah | 18 | 38 | .321 | 24 | L1 |
NBA News
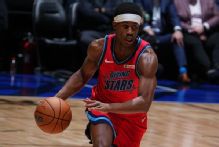
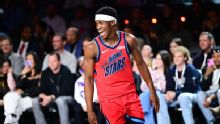
VJ Edgecombe leads Team Vince to 1-point win vs. Team Melo
Philadelphia rookie VJ Edgecombe led Team Vince to victory in the Rising Stars event at NBA All-Star weekend Friday night.
2h
NBA All-Star 2026: Live updates, highlights through the weekend
All of the live updates, top moments and results from NBA All-Star 2026 weekend in Los Angeles.
2h
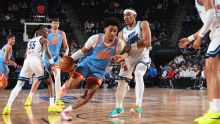
Dylan Harper sinks game-winner over his brother Ron Harper Jr.
Dylan Harper hits a fadeaway game-winner over his brother Ron Harper Jr. at the NBA Rising Stars game.
3h