
Sydney Kings @ Adelaide 36ers

Sydney KingsKingsSYD
13-15
82
13-15
Final
| 1 | 2 | 3 | 4 | T | |
|---|---|---|---|---|---|
Kings SYD | 19 | 8 | 27 | 28 | 82 |
36ers ADL | 20 | 22 | 28 | 25 | 95 |

Adelaide 36ers36ersADL
12-16
95
12-16
Game Leaders


20
J. Adams#2
5/18 FG, 10/13 FT
20
27
T. Kell#3
6/13 FG, 12/16 FT
27
9
J. Hunter#1
5 DREB, 4 OREB
9
12
I. Humphries#8
9 DREB, 3 OREB
12
4
J. Adams#2
1 TO, 30 MIN
4
8
D. Vasiljevic#34
3 TO, 33 MIN
8
Team Stats

SYD

ADL
36% (28-78)
Field Goal %
42% (30-72)
15% (5-33)
Three Point %
19% (5-27)
72% (21-29)
Free Throw %
86% (30-35)
11
Turnovers
14
41
Rebounds
50
Game Information
Adelaide, SA
Team Stats
 | | |
|---|---|---|
| FG | 28-78 | 30-72 |
| Field Goal % | 36 | 42 |
| 3PT | 5-33 | 5-27 |
| Three Point % | 15 | 19 |
| FT | 21-29 | 30-35 |
| Free Throw % | 72 | 86 |
| Rebounds | 41 | 50 |
| Offensive Rebounds | 13 | 13 |
| Defensive Rebounds | 28 | 37 |
| Assists | 12 | 20 |
| Steals | 7 | 7 |
| Blocks | 1 | 7 |
| Total Turnovers | 11 | 14 |
| Fouls | 25 | 22 |
| Technical Fouls | 0 | 0 |
| Flagrant Fouls | 0 | 0 |
Matchups
2025-26 NBL Standings
| W | L | PCT | GB | STRK | |
|---|---|---|---|---|---|
| Sydney | 24 | 9 | .727 | - | W11 |
| Adelaide | 23 | 10 | .697 | 1 | L1 |
| South East Melbourne | 22 | 11 | .667 | 2 | L1 |
| Perth | 21 | 12 | .636 | 3 | W1 |
| Melbourne | 20 | 13 | .606 | 4 | W1 |
| Tasmania | 14 | 19 | .424 | 10 | L2 |
| New Zealand | 13 | 20 | .394 | 11 | W1 |
| Illawarra | 13 | 20 | .394 | 11 | W2 |
| Cairns | 9 | 24 | .273 | 15 | L2 |
| Brisbane | 6 | 27 | .182 | 18 | L13 |
NBL News

NBL MVP: Who has won the Andrew Gaze Trophy?
The NBL has a distinguished list of MVPs.
1d
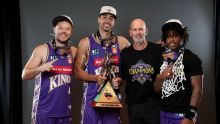
'Look what we've created here in Sydney': Reflections from the Kings' 2026 NBL Championship
Olgun Uluc reflects on an outrageously entertaining game that capped off one of the most contentious and enthralling Championship Series in the history of the NBL.
3d
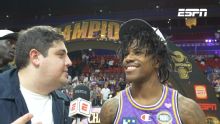
Sydney are Kings of the NBL for 2026
The Sydney Kings have claimed an historic victory in Game 5 of the NBL Championship series. ESPN's Olgun Uluc spoke with the winning side in their celebrations.
3d