
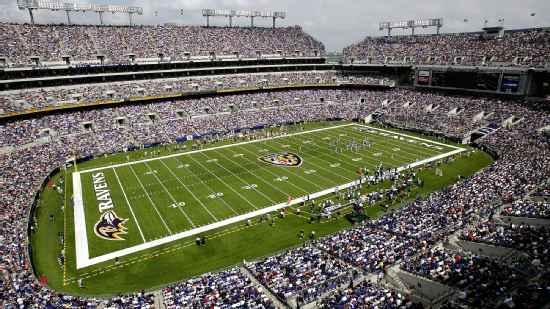
Houston Texans @ Baltimore Ravens

3-3, 1-2 Away
14
3-3, 1-2 Away

4-1, 3-0 Home
29
4-1, 3-0 Home
Game Leaders


Team Stats


293
Total Yards
402
0
Turnovers
2
18
1st Downs
24
5-15
Penalties
5-25
6/16
3rd Down
3/11
0/3
4th Down
0/0
1/1
Red Zone
2/4
27:48
Possession
32:12
Game Information
Baltimore, MD
Referee:Gene Steratore
Team Stats
 | | |
|---|---|---|
| 1st Downs | 18 | 24 |
| Passing 1st downs | 11 | 15 |
| Rushing 1st downs | 5 | 6 |
| 1st downs from penalties | 2 | 3 |
| 3rd down efficiency | 6-16 | 3-11 |
| 4th down efficiency | 0-3 | 0-0 |
| Total Plays | 66 | 65 |
| Total Yards | 293 | 402 |
| Total Drives | 12 | 12 |
| Yards per Play | 4.4 | 6.2 |
| Passing | 200 | 289 |
| Comp/Att | 21/37 | 20/33 |
| Yards per pass | 4.9 | 8.3 |
| Interceptions thrown | 0 | 1 |
| Sacks-Yards Lost | 4-20 | 2-16 |
| Rushing | 93 | 113 |
| Rushing Attempts | 25 | 30 |
| Yards per rush | 3.7 | 3.8 |
| Red Zone (Made-Att) | 1-1 | 2-4 |
| Penalties | 5-15 | 5-25 |
| Turnovers | 0 | 2 |
| Fumbles lost | 0 | 1 |
| Interceptions thrown | 0 | 1 |
| Defensive / Special Teams TDs | 1 | 0 |
| Possession | 27:48 | 32:12 |
2025 Standings
American Football Conference
| AFC South | W | L | T | PCT | PF | PA |
|---|---|---|---|---|---|---|
| Jacksonville | 13 | 4 | 0 | .765 | 474 | 336 |
| Houston | 12 | 5 | 0 | .706 | 404 | 295 |
| Indianapolis | 8 | 9 | 0 | .471 | 466 | 412 |
| Tennessee | 3 | 14 | 0 | .176 | 284 | 478 |
| AFC North | W | L | T | PCT | PF | PA |
|---|---|---|---|---|---|---|
| Pittsburgh | 10 | 7 | 0 | .588 | 397 | 387 |
| Baltimore | 8 | 9 | 0 | .471 | 424 | 398 |
| Cincinnati | 6 | 11 | 0 | .353 | 414 | 492 |
| Cleveland | 5 | 12 | 0 | .294 | 279 | 379 |
NFL News

Lagos to Lombardi - Nigeria's 34-year road to NFL Super Bowl history with the Seattle Seahawks
Six players of Nigerian descent represent the highest number ever to capture the NFL's Lombardi Trophy in a single season, winning with the Seahawks last Sunday, breaking the record of five set by the Kansas City Chiefs in 2022.
4h

Joey Porter: Ben Roethlisberger wasn't good teammate, person
Ex-Steelers linebacker and assistant coach Joey Porter Sr. said in a podcast last week that quarterback Ben Roethlisberger wasn't a good teammate or person.
13h

Darnold thanks Seahawks for believing in him as Seattle celebrates
Sam Darnold thanked the Seahawks for believing in him as the team celebrated its Super Bowl LX championship at Lumen Field.
14h