
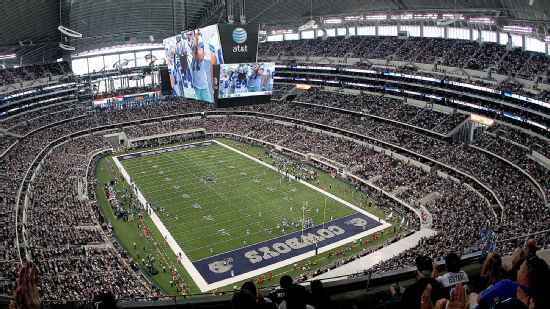
New Orleans Saints @ Dallas Cowboys

7-8, 3-5 Away
34
7-8, 3-5 Away

8-7, 4-4 Home
31
8-7, 4-4 Home
Game Leaders


446
D. BreesQB
37/53, 3 TD
446
416
T. RomoQB
26/43, 4 TD
416

53
M. Ingram IIRB
21 CAR, 1 TD
53
40
D. MurrayRB
11 CAR
40

153
M. ColstonWR
10 REC
153

224
D. BryantWR
9 REC, 2 TD
224

1
T. JohnsonDT
1

--
--

8
P. RobinsonCB
7 SOLO
8
11
D. ConnorLB
7 SOLO
11
Team Stats


562
Total Yards
446
0
Turnovers
1
33
1st Downs
18
6-42
Penalties
5-32
11/19
3rd Down
2/10
0/0
4th Down
1/1
0/0
Red Zone
0/0
41:59
Possession
22:28
Game Information
Arlington, TX
Referee:Walt Coleman
Team Stats
 | | |
|---|---|---|
| 1st Downs | 33 | 18 |
| Passing 1st downs | 25 | 16 |
| Rushing 1st downs | 5 | 2 |
| 1st downs from penalties | 3 | 0 |
| 3rd down efficiency | 11-19 | 2-10 |
| 4th down efficiency | 0-0 | 1-1 |
| Total Plays | 91 | 56 |
| Total Yards | 562 | 446 |
| Total Drives | 14 | 12 |
| Yards per Play | 6.2 | 8.0 |
| Passing | 446 | 406 |
| Comp/Att | 37/53 | 26/43 |
| Yards per pass | 8.4 | 9.0 |
| Interceptions thrown | 0 | 0 |
| Sacks-Yards Lost | 0-0 | 2-10 |
| Rushing | 116 | 40 |
| Rushing Attempts | 38 | 11 |
| Yards per rush | 3.1 | 3.6 |
| Red Zone (Made-Att) | 0-0 | 0-0 |
| Penalties | 6-42 | 5-32 |
| Turnovers | 0 | 1 |
| Fumbles lost | 0 | 1 |
| Interceptions thrown | 0 | 0 |
| Defensive / Special Teams TDs | 0 | 0 |
| Possession | 41:59 | 22:28 |
2025 Standings
National Football Conference
| NFC South | W | L | T | PCT | PF | PA |
|---|---|---|---|---|---|---|
| Carolina | 8 | 9 | 0 | .471 | 311 | 380 |
| Tampa Bay | 8 | 9 | 0 | .471 | 380 | 411 |
| Atlanta | 8 | 9 | 0 | .471 | 353 | 401 |
| New Orleans | 6 | 11 | 0 | .353 | 306 | 383 |
| NFC East | W | L | T | PCT | PF | PA |
|---|---|---|---|---|---|---|
| Philadelphia | 11 | 6 | 0 | .647 | 379 | 325 |
| Dallas | 7 | 9 | 1 | .441 | 471 | 511 |
| Washington | 5 | 12 | 0 | .294 | 356 | 451 |
| New York | 4 | 13 | 0 | .235 | 381 | 439 |
NFL News

Ashton Kutcher confident his beloved Bears will beat Packers
Ashton Kutcher previews the Packers-Bears wild-card game and is confident Chicago will get the job done.
10h

Inside Washington Commanders' high-stakes reset in 2026
Parting ways with Kliff Kingsbury was a bold move that raised the stakes for Dan Quinn & Co. this offseason.
10h

Stephen A.: 'Biggest disappointment' of playoffs if Rams lose to Panthers
Stephen A. Smith says it would be a massive disappointment if the Rams fail to beat the Panthers in the NFC Wild Card Game.
11h