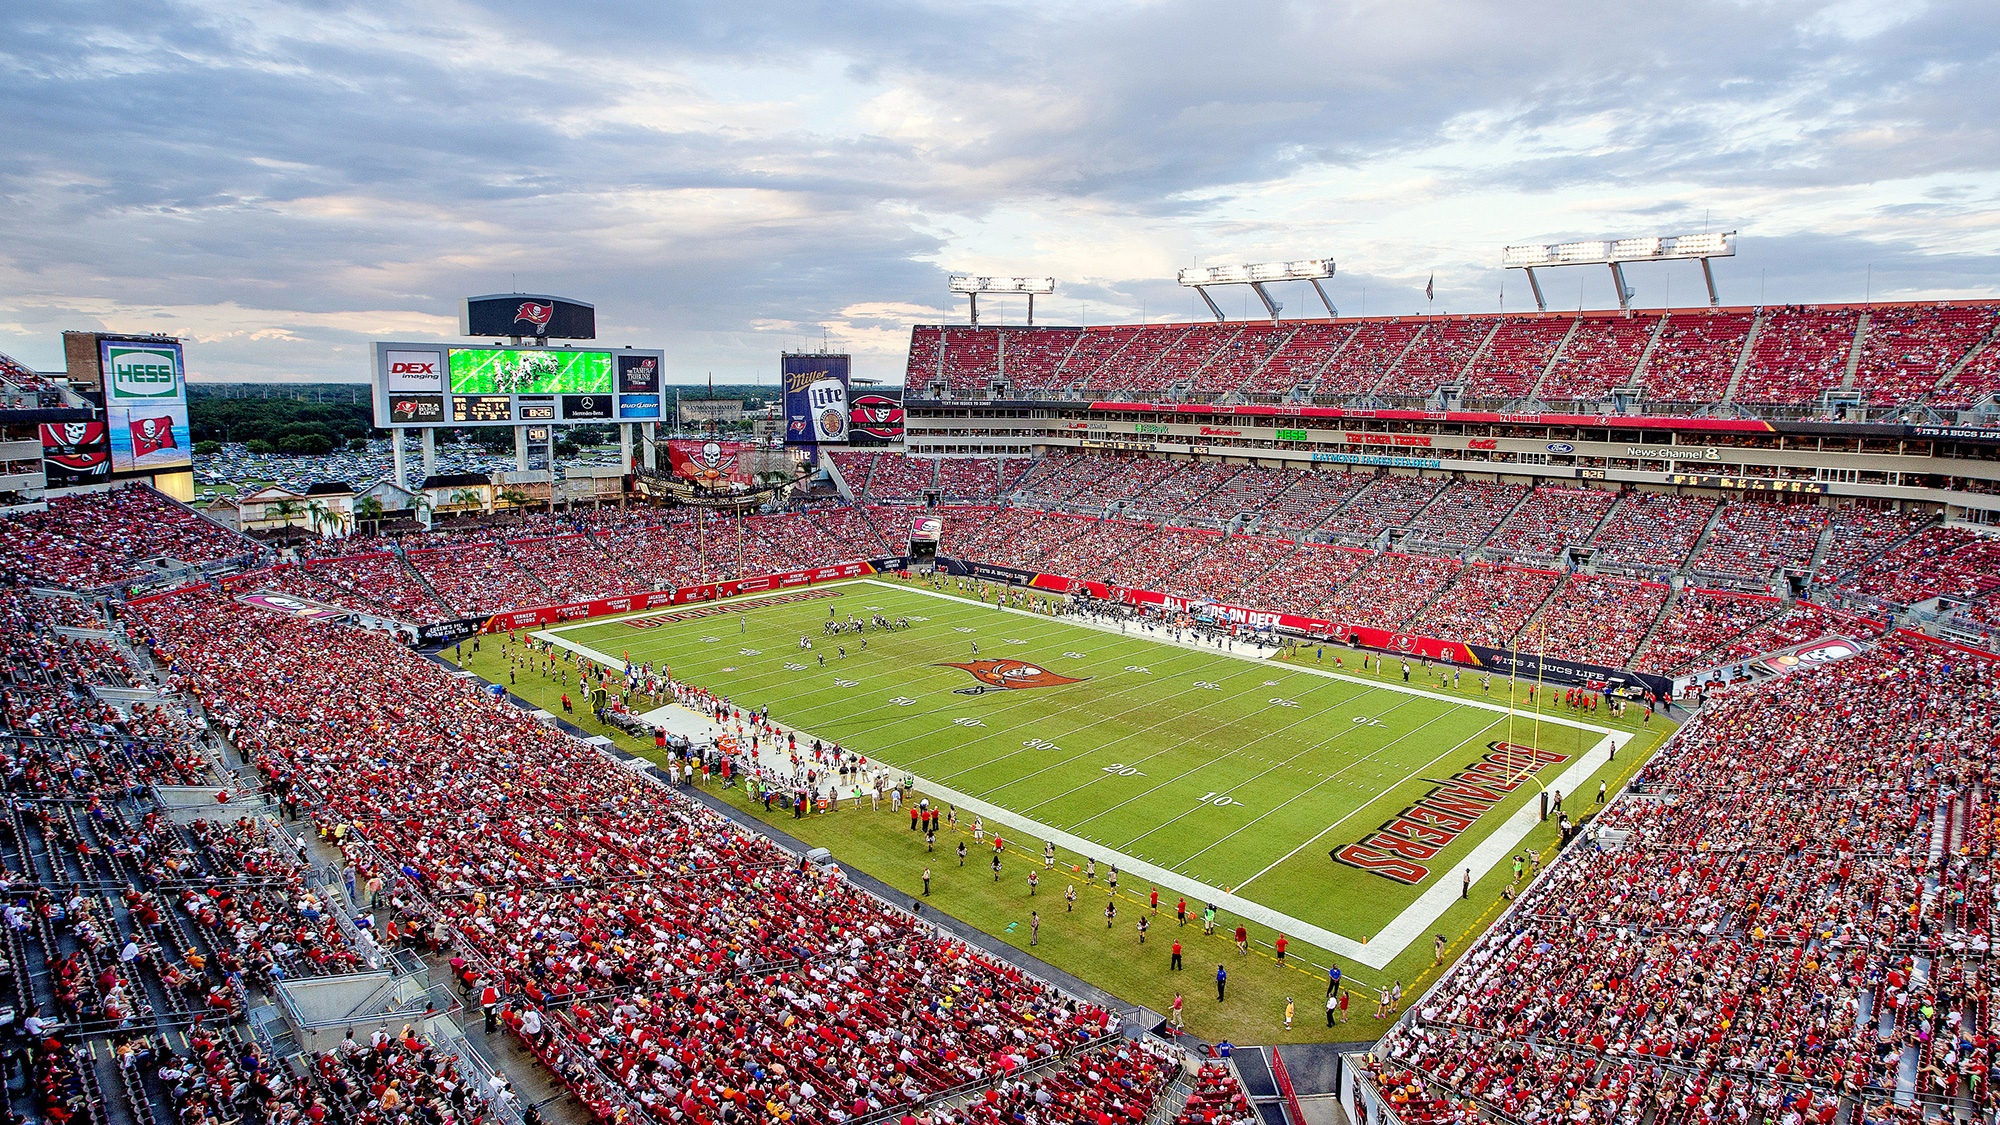
St. Louis Rams @ Tampa Bay Buccaneers
Game Leaders
Team Stats
285
Total Yards
429
2
Turnovers
5
14
1st Downs
23
9-64
Penalties
1-5
4/11
3rd Down
8/17
0/0
4th Down
0/4
0/0
Red Zone
0/0
24:01
Possession
35:59
Game Information
Tampa, FL

Referee:Scott Green

Team Stats
| 1st Downs | 14 | 23 |
| Passing 1st downs | 11 | 17 |
| Rushing 1st downs | 3 | 4 |
| 1st downs from penalties | 0 | 2 |
| 3rd down efficiency | 4-11 | 8-17 |
| 4th down efficiency | 0-0 | 0-4 |
| Total Plays | 54 | 81 |
| Total Yards | 285 | 429 |
| Total Drives | 12 | 13 |
| Yards per Play | 5.3 | 5.3 |
| Passing | 196 | 349 |
| Comp/Att | 13/27 | 30/54 |
| Yards per pass | 7.3 | 5.9 |
| Interceptions thrown | 1 | 4 |
| Sacks-Yards Lost | 0-0 | 5-23 |
| Rushing | 89 | 80 |
| Rushing Attempts | 27 | 22 |
| Yards per rush | 3.3 | 3.6 |
| Red Zone (Made-Att) | 0-0 | 0-0 |
| Penalties | 9-64 | 1-5 |
| Turnovers | 2 | 5 |
| Fumbles lost | 1 | 1 |
| Interceptions thrown | 1 | 4 |
| Defensive / Special Teams TDs | 2 | 0 |
| Possession | 24:01 | 35:59 |
2025 Standings
National Football Conference
| NFC South | W | L | T | PCT | PF | PA |
|---|---|---|---|---|---|---|
| Carolina | 8 | 7 | 0 | .533 | 287 | 337 |
| Tampa Bay | 7 | 8 | 0 | .467 | 347 | 377 |
| Atlanta | 6 | 9 | 0 | .400 | 307 | 360 |
| New Orleans | 5 | 10 | 0 | .333 | 255 | 338 |
NFL News

NFL Week 17 preview: Analysis, odds, stats
With two games on Saturday's lineup (Texans at Chargers and Ravens at Packers), here's stats, odds and more.
2h

Giants-Raiders loser could be big winner in NFL draft
There is a lot at stake for two 2-13 teams -- namely, the pole position for the No. 1 overall pick in the 2026 NFL draft.
3h

Fantasy football rankings for Week 17: IDP
Weekly fantasy football draft rankings for IDP leagues from Mike Clay, Tristan H. Cockcroft and Eric Moody.
3h
GAMBLING PROBLEM? CALL 1-800-GAMBLER, (800) 327-5050 or visit gamblinghelplinema.org (MA). Call 877-8-HOPENY/text HOPENY (467369) (NY). Please Gamble Responsibly. 888-789-7777/visit ccpg.org (CT), or visit www.mdgamblinghelp.org (MD). 21+ and present in most states. (18+ DC/KY/NH/WY). Void in ONT/OR/NH. Eligibility restrictions apply. On behalf of Boot Hill Casino & Resort (KS). Terms: sportsbook.draftkings.com/promos.
Copyright: © 2025 ESPN Enterprises, Inc. All rights reserved.


