
Pittsburgh Steelers @ Indianapolis Colts

6-5, 3-3 Away
28
6-5, 3-3 Away

5-6, 3-3 Home
7
5-6, 3-3 Home
Game Leaders


Team Stats


369
Total Yards
310
0
Turnovers
2
16
1st Downs
18
7-67
Penalties
2-10
7/11
3rd Down
8/15
0/0
4th Down
2/4
1/1
Red Zone
1/3
28:15
Possession
31:45
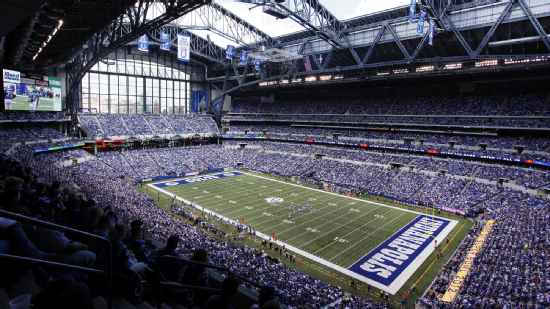
Game Information
Indianapolis, IN
Down Judge:Derick Bowers
Field Judge:James Coleman
Back Judge:Terrence Miles
Umpire:Jeff Rice
Referee:Walt Coleman
Line Judge:Kevin Codey
Side Judge:Alan Eck
Team Stats
 | | |
|---|---|---|
| 1st Downs | 16 | 18 |
| Passing 1st downs | 8 | 13 |
| Rushing 1st downs | 8 | 4 |
| 1st downs from penalties | 0 | 1 |
| 3rd down efficiency | 7-11 | 8-15 |
| 4th down efficiency | 0-0 | 2-4 |
| Total Plays | 50 | 63 |
| Total Yards | 369 | 310 |
| Total Drives | 9 | 9 |
| Yards per Play | 7.4 | 4.9 |
| Passing | 221 | 219 |
| Comp/Att | 14/21 | 23/37 |
| Yards per pass | 10.5 | 5.5 |
| Interceptions thrown | 0 | 2 |
| Sacks-Yards Lost | 0-0 | 3-21 |
| Rushing | 148 | 91 |
| Rushing Attempts | 29 | 23 |
| Yards per rush | 5.1 | 4.0 |
| Red Zone (Made-Att) | 1-1 | 1-3 |
| Penalties | 7-67 | 2-10 |
| Turnovers | 0 | 2 |
| Fumbles lost | 0 | 0 |
| Interceptions thrown | 0 | 2 |
| Defensive / Special Teams TDs | 0 | 0 |
| Possession | 28:15 | 31:45 |
2025 Standings
American Football Conference
| AFC North | W | L | T | PCT | PF | PA |
|---|---|---|---|---|---|---|
| Pittsburgh | 10 | 7 | 0 | .588 | 397 | 387 |
| Baltimore | 8 | 9 | 0 | .471 | 424 | 398 |
| Cincinnati | 6 | 11 | 0 | .353 | 414 | 492 |
| Cleveland | 5 | 12 | 0 | .294 | 279 | 379 |
| AFC South | W | L | T | PCT | PF | PA |
|---|---|---|---|---|---|---|
| Jacksonville | 13 | 4 | 0 | .765 | 474 | 336 |
| Houston | 12 | 5 | 0 | .706 | 404 | 295 |
| Indianapolis | 8 | 9 | 0 | .471 | 466 | 412 |
| Tennessee | 3 | 14 | 0 | .176 | 284 | 478 |
NFL News

OC Brian Fleury wants Seahawks to be 'fast, violent, aggressive'
Seahawks coach Mike Macdonald landed on Brian Fleury as his new offensive coordinator because "his vision ... was aligned with how we want it to."
5h
Tim Hasselbeck: Malik Willis will 'walk in as the anointed starter somewhere'
Tim Hasselbeck and Mina Kimes explain why they can see a strong free agent market for Malik Willis.
8h

Who will the Jets draft at No. 2?
Field Yates and Mina Kimes speculate on what the Jets could do with the No. 2 pick in this year's NFL draft.
9h