
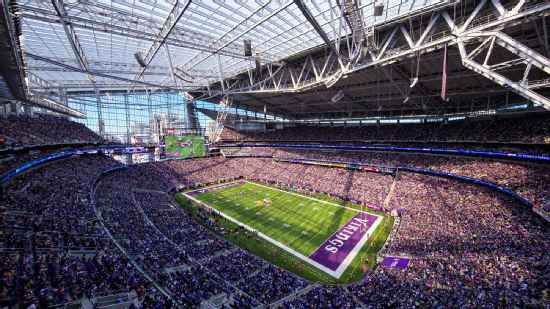
New Orleans Saints @ Minnesota Vikings

6-1, 4-0 Away
30
6-1, 4-0 Away

4-3-1, 2-2 Home
20
4-3-1, 2-2 Home
Game Leaders


120
D. BreesQB
18/23, 1 TD, 1 INT
120

359
K. CousinsQB
31/41, 2 TD, 1 INT
359
63
M. Ingram IIRB
13 CAR
63
56
L. MurrayRB
13 CAR, 1 TD
56

81
M. ThomasWR
5 REC
81
119
S. DiggsWR
10 REC, 1 TD
119

2
S. RankinsDT
2

--
None
--

9
E. AppleCB
9 SOLO
9

7
E. KendricksLB
2 SOLO
7
Team Stats


270
Total Yards
423
1
Turnovers
2
17
1st Downs
27
7-64
Penalties
6-54
4/9
3rd Down
5/10
0/0
4th Down
2/3
2/3
Red Zone
3/4
28:37
Possession
31:23
Game Information
Minneapolis, MN
Team Stats
 | | |
|---|---|---|
| 1st Downs | 17 | 27 |
| Passing 1st downs | 9 | 19 |
| Rushing 1st downs | 6 | 4 |
| 1st downs from penalties | 2 | 4 |
| 3rd down efficiency | 4-9 | 5-10 |
| 4th down efficiency | 0-0 | 2-3 |
| Total Plays | 53 | 67 |
| Total Yards | 270 | 423 |
| Total Drives | 8 | 10 |
| Yards per Play | 5.1 | 6.3 |
| Passing | 164 | 338 |
| Comp/Att | 19/24 | 31/41 |
| Yards per pass | 6.8 | 7.5 |
| Interceptions thrown | 1 | 1 |
| Sacks-Yards Lost | 0-0 | 4-21 |
| Rushing | 106 | 85 |
| Rushing Attempts | 29 | 22 |
| Yards per rush | 3.7 | 3.9 |
| Red Zone (Made-Att) | 2-3 | 3-4 |
| Penalties | 7-64 | 6-54 |
| Turnovers | 1 | 2 |
| Fumbles lost | 0 | 1 |
| Interceptions thrown | 1 | 1 |
| Defensive / Special Teams TDs | 2 | 0 |
| Possession | 28:37 | 31:23 |
2025 Standings
NFL News
2026 NFL season: New coach-player scheme pairings to watch
Can Brian Daboll take Cam Ward's game to another level? How will Sean Payton scheme up Jaylen Waddle? Is the Chris Shula-Myles Garrett combo unstoppable?
3h

Rising coach on 49ers' staff? Former Seahawk K.J. Wright
The former Seahawks linebacker faced the 49ers many times ... but now he's coaching Fred Warner & Co.
3h

Execs, coaches rank top NFL off-ball linebackers for 2026
Evaluators around the league ranked their top 10 off-ball linebackers. Is Fred Warner still No. 1? Which young standout is high on the list?
3h