
Washington Huskies @ Stanford Cardinal

5-2, 1-2 Away
21
5-2, 1-2 Away
Final
| 1 | 2 | 3 | 4 | T | |
|---|---|---|---|---|---|
WASH | 7 | 7 | 0 | 7 | 21 |
STAN | 10 | 28 | 10 | 17 | 65 |

7-0, 4-0 Home
65
7-0, 4-0 Home
Game Leaders


Team Stats


430
Total Yards
615
3
Turnovers
0
19
1st Downs
26
7-84
Penalties
9-58
6/13
3rd Down
8/12
0/0
4th Down
0/0
16:00
Possession
19:59
Game Information
Stanford, CA

Team Stats
 | | |
|---|---|---|
| 1st Downs | 19 | 26 |
| 3rd down efficiency | 6-13 | 8-12 |
| 4th down efficiency | 0-0 | 0-0 |
| Total Yards | 430 | 615 |
| Passing | 267 | 169 |
| Comp/Att | 24/38 | 16/22 |
| Yards per pass | 6.8 | 7.7 |
| Interceptions thrown | 2 | 0 |
| Rushing | 172 | 446 |
| Rushing Attempts | 26 | 44 |
| Yards per rush | 6.6 | 10.1 |
| Penalties | 7-84 | 9-58 |
| Turnovers | 3 | 0 |
| Fumbles lost | 1 | 0 |
| Interceptions thrown | 2 | 0 |
| Possession | 16:00 | 19:59 |
2025 Standings
FBS
| Big Ten Conference | CONF | OVR |
|---|---|---|
| Indiana | 9-0 | 16-0 |
| Ohio State | 9-0 | 12-2 |
| Oregon | 8-1 | 13-2 |
| USC | 7-2 | 9-4 |
| Michigan | 7-2 | 9-4 |
| Iowa | 6-3 | 9-4 |
| Washington | 5-4 | 9-4 |
| Illinois | 5-4 | 9-4 |
| Minnesota | 5-4 | 8-5 |
| Nebraska | 4-5 | 7-6 |
| Northwestern | 4-5 | 7-6 |
| UCLA | 3-6 | 3-9 |
| Penn State | 3-6 | 7-6 |
| Rutgers | 2-7 | 5-7 |
| Wisconsin | 2-7 | 4-8 |
| Michigan State | 1-8 | 4-8 |
| Maryland | 1-8 | 4-8 |
| Purdue | 0-9 | 2-10 |
| Atlantic Coast Conference | CONF | OVR |
|---|---|---|
| Virginia | 7-1 | 11-3 |
| SMU | 6-2 | 9-4 |
| Miami | 6-2 | 13-3 |
| Pittsburgh | 6-2 | 8-5 |
| Georgia Tech | 6-2 | 9-4 |
| Duke | 6-2 | 9-5 |
| NC State | 4-4 | 8-5 |
| California | 4-4 | 7-6 |
| Clemson | 4-4 | 7-6 |
| Louisville | 4-4 | 9-4 |
| Wake Forest | 4-4 | 9-4 |
| Stanford | 3-5 | 4-8 |
| Florida State | 2-6 | 5-7 |
| North Carolina | 2-6 | 4-8 |
| Virginia Tech | 2-6 | 3-9 |
| Boston College | 1-7 | 2-10 |
| Syracuse | 1-7 | 3-9 |
NCAAF News
Colorado opts to practice, mourns death of Dominiq Ponder
The Colorado Buffaloes mourned teammate Dominiq Ponder at practice after the 23-year-old died in a single-car crash Sunday.
16h

Jurors deadlock, judge declares mistrial in Miami football murder case
Jurors sent out a pair of notes on their second day of deliberations to say they were hopelessly deadlocked.
17h
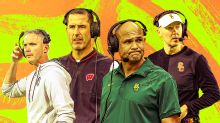
Way-too-early college football coaching hot seat tiers
The coaching carousel was unprecedented in 2025. What could it hold next season?
1d