
California Golden Bears @ Washington State Cougars

4-1, 2-1 Pac-12
60
4-1, 2-1 Pac-12
Final
| 1 | 2 | 3 | 4 | T | |
|---|---|---|---|---|---|
CAL | 0 | 13 | 28 | 19 | 60 |
| 10 | 14 | 28 | 7 | 59 |

2-4, 1-2 Pac-12
59
2-4, 1-2 Pac-12
Game Leaders


Team Stats


589
Total Yards
812
0
Turnovers
0
27
1st Downs
33
8-34
Penalties
12-121
5/12
3rd Down
7/15
2/2
4th Down
2/3
23:18
Possession
35:00
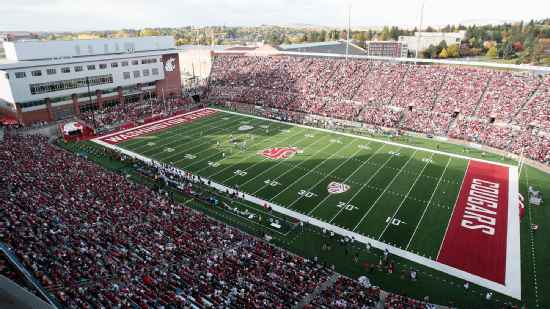
Game Information
Pullman, WA
Team Stats
 | | |
|---|---|---|
| 1st Downs | 27 | 33 |
| 3rd down efficiency | 5-12 | 7-15 |
| 4th down efficiency | 2-2 | 2-3 |
| Total Yards | 589 | 812 |
| Passing | 527 | 734 |
| Comp/Att | 37/53 | 49/70 |
| Yards per pass | 9.9 | 10.5 |
| Interceptions thrown | 0 | 0 |
| Rushing | 62 | 78 |
| Rushing Attempts | 18 | 25 |
| Yards per rush | 3.4 | 3.1 |
| Penalties | 8-34 | 12-121 |
| Turnovers | 0 | 0 |
| Fumbles lost | 0 | 0 |
| Interceptions thrown | 0 | 0 |
| Possession | 23:18 | 35:00 |
2025 Standings
FBS
| Atlantic Coast Conference | CONF | OVR |
|---|---|---|
| Virginia | 7-1 | 11-3 |
| SMU | 6-2 | 9-4 |
| Miami | 6-2 | 13-3 |
| Pittsburgh | 6-2 | 8-5 |
| Georgia Tech | 6-2 | 9-4 |
| Duke | 6-2 | 9-5 |
| NC State | 4-4 | 8-5 |
| California | 4-4 | 7-6 |
| Clemson | 4-4 | 7-6 |
| Louisville | 4-4 | 9-4 |
| Wake Forest | 4-4 | 9-4 |
| Stanford | 3-5 | 4-8 |
| Florida State | 2-6 | 5-7 |
| North Carolina | 2-6 | 4-8 |
| Virginia Tech | 2-6 | 3-9 |
| Boston College | 1-7 | 2-10 |
| Syracuse | 1-7 | 3-9 |
| Pac-12 Conference | CONF | OVR |
|---|---|---|
| Washington State | 1-1 | 7-6 |
| Oregon State | 1-1 | 2-10 |
NCAAF News

Key college football returning players for each top 25 team
With all the focus on the portal, we look at the most important players retained across college football.
13h

2026 NFL mock drafts: Latest ESPN player, team predictions
Here are our experts' NFL mock drafts for the 2026 cycle, including projected landing spots for all the top quarterbacks.
13h

2026 NFL mock draft: Mel Kiper's pick predictions for Round 1
As the NFL gets ready for this week's combine workouts, let's project where the best players in the 2026 NFL draft class will get picked in April.
9h