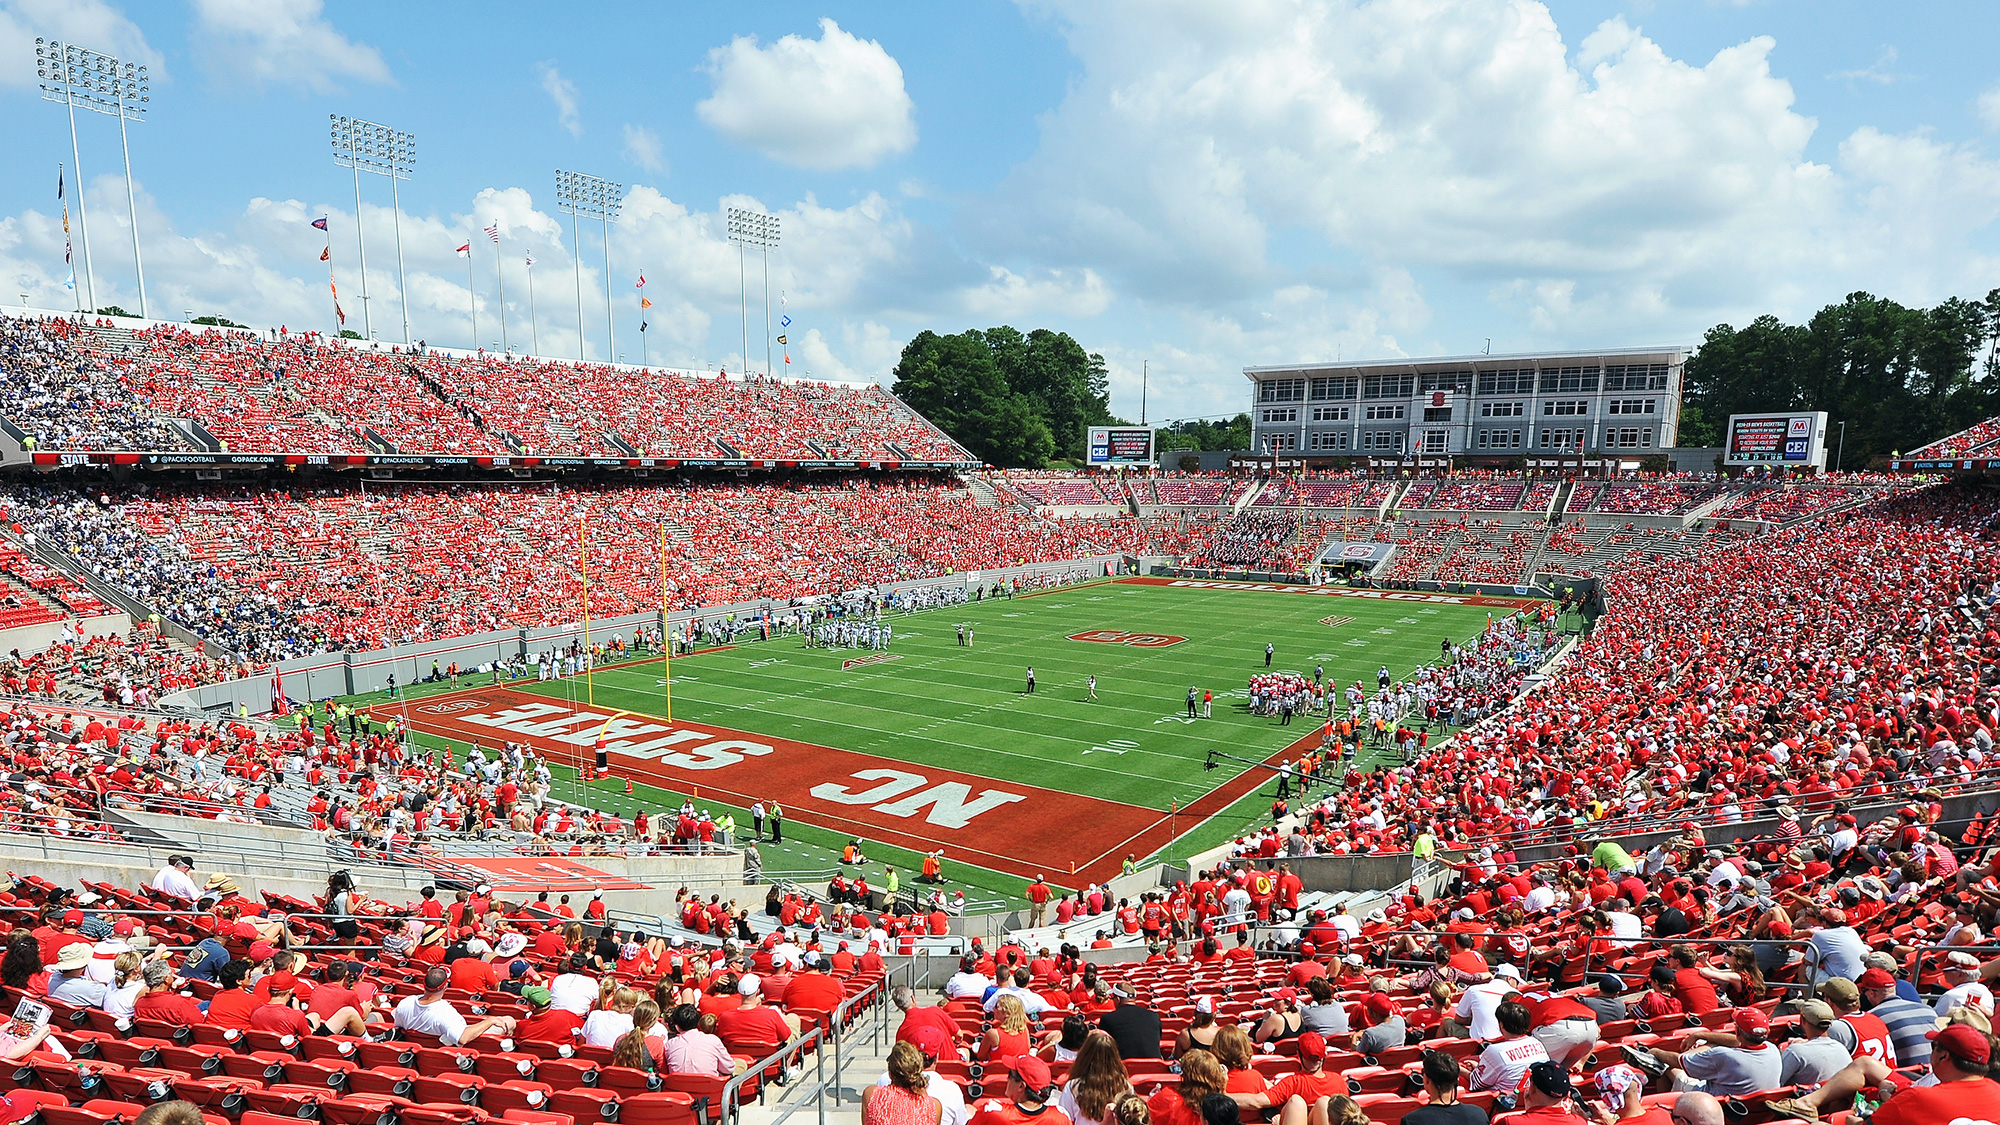
Clemson Tigers @ NC State Wolfpack
Game Leaders
Team Stats
415
Total Yards
491
1
Turnovers
2
19
1st Downs
27
3-23
Penalties
6-69
7/16
3rd Down
3/13
2/2
4th Down
2/3
25:12
Possession
34:48
Game Information
Raleigh, NC


Team Stats
| 1st Downs | 19 | 27 |
| 3rd down efficiency | 7-16 | 3-13 |
| 4th down efficiency | 2-2 | 2-3 |
| Total Yards | 415 | 491 |
| Passing | 191 | 338 |
| Comp/Att | 20/38 | 31/50 |
| Yards per pass | 5.0 | 6.8 |
| Interceptions thrown | 1 | 2 |
| Rushing | 224 | 153 |
| Rushing Attempts | 35 | 34 |
| Yards per rush | 6.4 | 4.5 |
| Penalties | 3-23 | 6-69 |
| Turnovers | 1 | 2 |
| Fumbles lost | 0 | 0 |
| Interceptions thrown | 1 | 2 |
| Possession | 25:12 | 34:48 |
CLEM @ NCST Videos
Clemson survives test from NC State
- 0:56
INT seals the victory for Clemson
- 0:41
NC State responds with another passing TD
- 0:18
2025 Standings
FBS
| Atlantic Coast ConferenceAtlantic Coast Conference | CONF | OVR |
|---|---|---|
| Virginia | 7-1 | 11-3 |
| SMU | 6-2 | 9-4 |
| Miami | 6-2 | 13-3 |
| Pittsburgh | 6-2 | 8-5 |
| Georgia Tech | 6-2 | 9-4 |
| Duke | 6-2 | 9-5 |
| NC State | 4-4 | 8-5 |
| California | 4-4 | 7-6 |
| Clemson | 4-4 | 7-6 |
| Louisville | 4-4 | 9-4 |
| Wake Forest | 4-4 | 9-4 |
| Stanford | 3-5 | 4-8 |
| Florida State | 2-6 | 5-7 |
| North Carolina | 2-6 | 4-8 |
| Virginia Tech | 2-6 | 3-9 |
| Boston College | 1-7 | 2-10 |
| Syracuse | 1-7 | 3-9 |
NCAAF News

Gary Patterson revitalized in coaching return as USC's DC
Hall of Fame coach Gary Patterson said he is revitalized in his return to coaching as Southern Cal's defensive coordinator.
11h

Senior Bowl practices for 2026 NFL draft: Best QBs, prospects
Here are the top NFL draft risers from the second day of Senior Bowl practices, including an FCS QB who is making a statement.
11h

NFeLementary, the football-based curriculum taking over Mary Crippen's classroom
Mary Crippen, a third grade educator based in Florida, built NFeLementary by expanding on a football-based curriculum her mother created decades earlier.
1d
GAMBLING PROBLEM? CALL 1-800-GAMBLER, (800) 327-5050 or visit gamblinghelplinema.org (MA). Call 877-8-HOPENY/text HOPENY (467369) (NY). Please Gamble Responsibly. 888-789-7777/visit ccpg.org (CT), or visit www.mdgamblinghelp.org (MD). 21+ and present in most states. (18+ DC/KY/NH/WY). Void in ONT/OR/NH. Eligibility restrictions apply. On behalf of Boot Hill Casino & Resort (KS). Terms: sportsbook.draftkings.com/promos.
Copyright: © 2026 ESPN Enterprises, Inc. All rights reserved.


