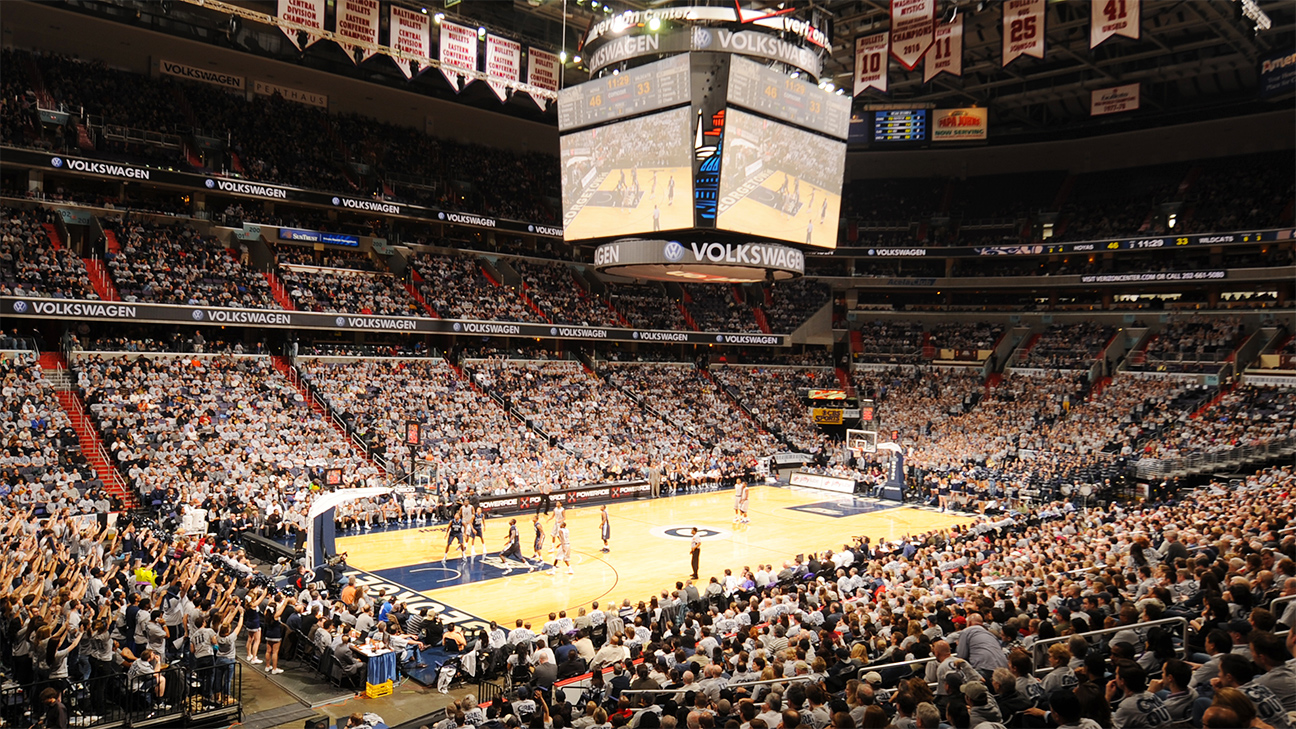
George Mason Patriots @ Wichita State Shockers
Game Leaders
Team Stats
45% (20-44)
Field Goal %
31% (20-64)
50% (8-16)
Three Point %
13% (3-24)
65% (15-23)
Free Throw %
71% (12-17)
9
Turnovers
9
32
Rebounds
43
19
Largest Lead
0
Game Information
Washington, DC


Team Stats
| FG | 20-44 | 20-64 |
| Field Goal % | 45 | 31 |
| 3PT | 8-16 | 3-24 |
| Three Point % | 50 | 13 |
| FT | 15-23 | 12-17 |
| Free Throw % | 65 | 71 |
| Rebounds | 32 | 43 |
| Offensive Rebounds | 2 | 17 |
| Defensive Rebounds | 30 | 26 |
| Assists | 12 | 8 |
| Steals | 5 | 4 |
| Blocks | 5 | 1 |
| Total Turnovers | 9 | 9 |
| Points Off Turnovers | 0 | 0 |
| Fast Break Points | 0 | 0 |
| Points in Paint | 0 | 0 |
| Fouls | 16 | 21 |
| Technical Fouls | 0 | 0 |
| Flagrant Fouls | 0 | 0 |
| Largest Lead | 19 | 0 |
2025-26 Standings
NCAA Division I
| Atlantic 10 ConferenceAtlantic 10 Conference | CONF | GB | OVR |
|---|---|---|---|
| Saint Louis | 11-0 | - | 23-1 |
| VCU | 10-2 | 1.5 | 19-6 |
| George Mason | 9-3 | 2.5 | 21-4 |
| Saint Joseph's | 7-5 | 4.5 | 15-10 |
| Dayton | 6-5 | 5 | 15-9 |
| Davidson | 6-5 | 5 | 15-9 |
| Duquesne | 6-5 | 5 | 14-10 |
| Rhode Island | 5-6 | 6 | 14-10 |
| George Washington | 5-7 | 6.5 | 14-11 |
| Richmond | 4-8 | 7.5 | 14-11 |
| Fordham | 4-8 | 7.5 | 13-12 |
| St. Bonaventure | 3-8 | 8 | 14-10 |
| La Salle | 3-9 | 8.5 | 7-18 |
| Loyola Chicago | 2-10 | 9.5 | 6-19 |
| American ConferenceAmerican Conference | CONF | GB | OVR |
|---|---|---|---|
| South Florida | 9-3 | - | 17-8 |
| Tulsa | 8-4 | 1 | 20-5 |
| Temple | 7-4 | 1.5 | 15-9 |
| Charlotte | 7-4 | 1.5 | 13-11 |
| Memphis | 7-4 | 1.5 | 12-11 |
| UAB | 7-5 | 2 | 16-9 |
| Wichita State | 7-5 | 2 | 15-10 |
| Florida Atlantic | 6-6 | 3 | 14-11 |
| Tulane | 5-6 | 3.5 | 14-10 |
| Rice | 5-7 | 4 | 11-14 |
| North Texas | 4-7 | 4.5 | 13-11 |
| East Carolina | 3-8 | 5.5 | 8-16 |
| UTSA | 0-12 | 9 | 4-20 |
Men's College Basketball News

San Diego defeats Portland 71-58
— Juan Sebastian Gorosito scored 19 points as San Diego beat Portland 71-58 on Wednesday night.
14h

Soumaoro's 15 help Western Carolina take down Citadel 87-49
— Julien Soumaoro had 15 points in Western Carolina's 87-49 victory against Citadel on Wednesday.
14h

Colgate knocks off Holy Cross 74-70
— Sam Wright's 18 points helped Colgate defeat Holy Cross 74-70 on Wednesday.
14h
GAMBLING PROBLEM? CALL 1-800-GAMBLER, (800) 327-5050 or visit gamblinghelplinema.org (MA). Call 877-8-HOPENY/text HOPENY (467369) (NY). Please Gamble Responsibly. 888-789-7777/visit ccpg.org (CT), or visit www.mdgamblinghelp.org (MD). 21+ and present in most states. (18+ DC/KY/NH/WY). Void in ONT/OR/NH. Eligibility restrictions apply. On behalf of Boot Hill Casino & Resort (KS). Terms: sportsbook.draftkings.com/promos.
Copyright: © 2026 ESPN Enterprises, Inc. All rights reserved.


