
Hofstra Pride @ Old Dominion Monarchs

9-8, 2-3 CAA
46
9-8, 2-3 CAA
Final
| 1 | 2 | T | |
|---|---|---|---|
HOF | 18 | 28 | 46 |
ODU | 29 | 28 | 57 |

12-5, 4-1 CAA
57
12-5, 4-1 CAA
Game Leaders


Team Stats


36% (19-53)
Field Goal %
33% (20-60)
13% (2-16)
Three Point %
21% (3-14)
60% (6-10)
Free Throw %
41% (14-34)
21
Turnovers
9
41
Rebounds
45
0
Largest Lead
15
Game Information
Norfolk, VA
Team Stats
 | | |
|---|---|---|
| FG | 19-53 | 20-60 |
| Field Goal % | 36 | 33 |
| 3PT | 2-16 | 3-14 |
| Three Point % | 13 | 21 |
| FT | 6-10 | 14-34 |
| Free Throw % | 60 | 41 |
| Rebounds | 41 | 45 |
| Offensive Rebounds | 9 | 18 |
| Defensive Rebounds | 32 | 27 |
| Assists | 8 | 10 |
| Steals | 6 | 13 |
| Blocks | 5 | 5 |
| Total Turnovers | 21 | 9 |
| Points Off Turnovers | 0 | 0 |
| Fast Break Points | 0 | 0 |
| Points in Paint | 0 | 0 |
| Fouls | 25 | 10 |
| Technical Fouls | 0 | 0 |
| Flagrant Fouls | 0 | 0 |
| Largest Lead | 0 | 15 |
2025-26 Standings
NCAA Division I
| Coastal Athletic Association | CONF | GB | OVR |
|---|---|---|---|
| Charleston | 9-2 | - | 16-8 |
| UNC Wilmington | 8-2 | 0.5 | 19-4 |
| Hofstra | 7-5 | 2.5 | 16-9 |
| Stony Brook | 7-5 | 2.5 | 15-10 |
| Drexel | 7-5 | 2.5 | 13-12 |
| Monmouth | 6-5 | 3 | 12-12 |
| William & Mary | 6-6 | 3.5 | 15-9 |
| Campbell | 6-6 | 3.5 | 12-13 |
| Hampton | 6-6 | 3.5 | 12-13 |
| Towson | 5-7 | 4.5 | 13-12 |
| Elon | 5-7 | 4.5 | 13-12 |
| North Carolina A&T | 2-10 | 7.5 | 9-14 |
| Northeastern | 2-10 | 7.5 | 6-17 |
| Sun Belt Conference | CONF | GB | OVR |
|---|---|---|---|
| Troy | 9-3 | - | 17-8 |
| App State | 9-4 | 0.5 | 17-9 |
| South Alabama | 7-4 | 1.5 | 17-7 |
| Marshall | 7-4 | 1.5 | 15-9 |
| Coastal Carolina | 7-6 | 2.5 | 15-11 |
| Texas State | 7-6 | 2.5 | 15-11 |
| Arkansas State | 6-6 | 3 | 15-10 |
| Georgia Southern | 6-6 | 3 | 14-11 |
| Louisiana | 6-6 | 3 | 9-16 |
| Georgia State | 6-6 | 3 | 9-16 |
| Southern Miss | 6-7 | 3.5 | 13-13 |
| James Madison | 4-8 | 5 | 12-13 |
| Old Dominion | 4-8 | 5 | 8-17 |
| UL Monroe | 1-11 | 8 | 4-21 |
Men's College Basketball News

Seth Trimble hits late 3 to lift No. 14 UNC past No. 4 Duke 71-68 in stunning rivalry finish
— Seth Trimble made a corner 3-pointer with 0.4 seconds left to lift No. 14 North Carolina past No. 4 Duke 71-68 in a stunning finish Saturday night, which included fans storming the court prematurely before having to clear out for the Blue Devils to...
6h
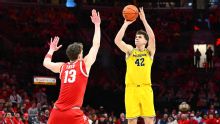
Aday Mara scores 24 points and No. 2 Michigan routs rival Ohio State 82-61
— Aday Mara scored a career-high 24 points, Morez Johnson Jr. and Yaxel Lendeborg had double-doubles and second-ranked Michigan rolled to an 82-61 victory over Ohio State on Sunday.
6h

Gibbs-Lawhorn leads UNLV against San Jose State after 29-point game
San Jose State Spartans (6-17, 1-11 MWC) at UNLV Rebels (11-12, 6-6 MWC)
6h