
Detroit Pistons @ Golden State Warriors

3-5, 2-3 Away
102
3-5, 2-3 Away

0-7, 0-2 Home
71
0-7, 0-2 Home
Game Leaders


Team Stats


48% (35-73)
Field Goal %
37% (29-79)
60% (3-5)
Three Point %
11% (1-9)
83% (29-35)
Free Throw %
63% (12-19)
30
Turnovers
30
58
Rebounds
43
Game Information
Oakland, CA
Referee:Bernie Fryer
Referee:Greg Willard
Referee:Tim Donaghy
Team Stats
 | | |
|---|---|---|
| FG | 35-73 | 29-79 |
| Field Goal % | 48 | 37 |
| 3PT | 3-5 | 1-9 |
| Three Point % | 60 | 11 |
| FT | 29-35 | 12-19 |
| Free Throw % | 83 | 63 |
| Rebounds | 58 | 43 |
| Offensive Rebounds | 10 | 12 |
| Defensive Rebounds | 38 | 24 |
| Assists | 26 | 18 |
| Steals | 12 | 8 |
| Blocks | 3 | 5 |
| Total Turnovers | 30 | 30 |
| Points Conceded Off Turnovers | 13 | 15 |
| Fast Break Points | 0 | 0 |
| Points in Paint | -1 | -1 |
| Fouls | 22 | 24 |
| Technical Fouls | 0 | 1 |
| Flagrant Fouls | 0 | 0 |
Matchups
2025-26 Standings
Western Conference
| Pacific | W | L | PCT | GB | STRK |
|---|---|---|---|---|---|
| LA Lakers | 45 | 25 | .643 | - | W8 |
| Phoenix | 39 | 31 | .557 | 6 | L4 |
| LA Clippers | 34 | 36 | .486 | 11 | L4 |
| Golden State | 33 | 37 | .471 | 12 | L2 |
| Sacramento | 18 | 53 | .254 | 27.5 | L2 |
NBA News
Gilgeous-Alexander scores 40, Thunder pull away for 132-111 win over Wizards after early scuffle
— Shai Gilgeous-Alexander scored 40 points and the Oklahoma Thunder pulled away in the fourth quarter to beat the Washington Wizards 132-111 on Saturday night for their 11th straight win, a game during which
21m

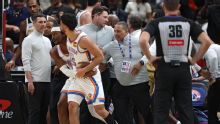
Four ejected after Thunder-Wizards altercation
Oklahoma City's Jaylin Williams and Washington's Justin Champagnie were ejected following an altercation late in the first half of Sunday night's 132-111 Thunder win.
17m
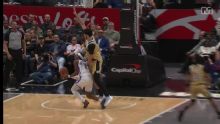
Oklahoma City Thunder vs. Washington Wizards: Game Highlights
Oklahoma City Thunder vs. Washington Wizards: Game Highlights
39m