
Boston Celtics @ Orlando Magic
EASTERN CONFERENCE FINALS - GAME 2 • BOS leads series 2-0

50-32, 26-15 Away
95
50-32, 26-15 Away

59-23, 34-7 Home
92
59-23, 34-7 Home
Game Leaders


Team Stats


46% (34-74)
Field Goal %
39% (28-71)
33% (5-15)
Three Point %
39% (7-18)
79% (22-28)
Free Throw %
76% (29-38)
15
Turnovers
14
47
Rebounds
51
11
Largest Lead
3
Game Information
Orlando, FL
Team Stats
 | | |
|---|---|---|
| FG | 34-74 | 28-71 |
| Field Goal % | 46 | 39 |
| 3PT | 5-15 | 7-18 |
| Three Point % | 33 | 39 |
| FT | 22-28 | 29-38 |
| Free Throw % | 79 | 76 |
| Rebounds | 47 | 51 |
| Offensive Rebounds | 9 | 10 |
| Defensive Rebounds | 29 | 26 |
| Assists | 20 | 18 |
| Steals | 7 | 9 |
| Blocks | 6 | 2 |
| Total Turnovers | 15 | 14 |
| Points Conceded Off Turnovers | 22 | 17 |
| Fast Break Points | 10 | 11 |
| Points in Paint | 36 | 34 |
| Fouls | 29 | 25 |
| Technical Fouls | 1 | 2 |
| Flagrant Fouls | 0 | 1 |
| Largest Lead | 11 | 3 |
Matchups
2025-26 Standings
Eastern Conference
| Atlantic | W | L | PCT | GB | STRK |
|---|---|---|---|---|---|
| Boston | 56 | 26 | .683 | - | W2 |
| New York | 53 | 29 | .646 | 3 | L1 |
| Toronto | 46 | 36 | .561 | 10 | W1 |
| Philadelphia | 45 | 37 | .549 | 11 | W2 |
| Brooklyn | 20 | 62 | .244 | 36 | L3 |
| Southeast | W | L | PCT | GB | STRK |
|---|---|---|---|---|---|
| Atlanta | 46 | 36 | .561 | - | L1 |
| Orlando | 45 | 37 | .549 | 1 | L1 |
| Charlotte | 44 | 38 | .537 | 2 | W1 |
| Miami | 43 | 39 | .524 | 3 | W2 |
| Washington | 17 | 65 | .207 | 29 | L10 |
NBA News
NBA summer league superlatives: Which players impressed?
With summer league now over, we select 10 players who stood out in Las Vegas.
5h
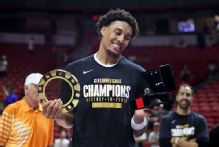
Lendeborg outduels Boozer as Dubs claim summer league title
Yaxel Lendeborg helped the Warriors to their second summer league championship, becoming just the second player to win a Division I NCAA championship and a summer league title in the same year.
13h
Who has won NBA summer league? List of champions
The NBA crowns a summer league champion each year. See which teams have won throughout history.
15h