
Oklahoma City Thunder @ San Antonio Spurs

36-20, 16-12 Away
105
36-20, 16-12 Away

47-10, 26-2 Home
109
47-10, 26-2 Home
Game Leaders


Team Stats


41% (37-91)
Field Goal %
45% (37-83)
29% (7-24)
Three Point %
62% (13-21)
89% (24-27)
Free Throw %
79% (22-28)
10
Turnovers
8
61
Rebounds
48
8
Largest Lead
11
Game Information
San Antonio, TX
Referee:Jason Phillips
Referee:Matt Boland
Referee:Mark Lindsay
Team Stats
 | | |
|---|---|---|
| FG | 37-91 | 37-83 |
| Field Goal % | 41 | 45 |
| 3PT | 7-24 | 13-21 |
| Three Point % | 29 | 62 |
| FT | 24-27 | 22-28 |
| Free Throw % | 89 | 79 |
| Rebounds | 61 | 48 |
| Offensive Rebounds | 13 | 4 |
| Defensive Rebounds | 41 | 33 |
| Assists | 15 | 24 |
| Steals | 6 | 5 |
| Blocks | 3 | 5 |
| Total Turnovers | 10 | 8 |
| Points Conceded Off Turnovers | 8 | 9 |
| Fast Break Points | 17 | 20 |
| Points in Paint | 32 | 38 |
| Fouls | 23 | 18 |
| Technical Fouls | 1 | 3 |
| Flagrant Fouls | 1 | 0 |
| Largest Lead | 8 | 11 |
Matchups
2025-26 Standings
Western Conference
| Northwest | W | L | PCT | GB | STRK |
|---|---|---|---|---|---|
| Oklahoma City | 64 | 18 | .780 | - | L2 |
| Denver | 54 | 28 | .659 | 10 | W12 |
| Minnesota | 49 | 33 | .598 | 15 | W2 |
| Portland | 42 | 40 | .512 | 22 | W2 |
| Utah | 22 | 60 | .268 | 42 | L1 |
| Southwest | W | L | PCT | GB | STRK |
|---|---|---|---|---|---|
| San Antonio | 62 | 20 | .756 | - | L1 |
| Houston | 52 | 30 | .634 | 10 | W1 |
| New Orleans | 26 | 56 | .317 | 36 | L2 |
| Dallas | 26 | 56 | .317 | 36 | W1 |
| Memphis | 25 | 57 | .305 | 37 | L8 |
NBA News
Sources: Grizzlies land Post after Warriors pass on offer sheet
The Warriors will not match the three-year, $30 million offer sheet for reserve center Quinten Post, allowing the restricted free agent to join the Grizzlies.
6h
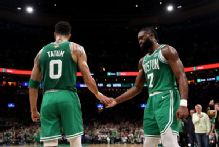
Tatum: 'Tough' to see Brown go, proud of 'great years' together
Jayson Tatum reflected on the "abrupt ending" of his longtime partnership with Jaylen Brown while appreciating what the pair accomplished together.
6h
Khris Middleton back at Wiz for 2nd stint in 6-team sign-and-trade deal
The Washington Wizards are bringing back veteran Khris Middleton on a three-year, $17.6 million contract via a sign-and-trade deal, his agent told ESPN's Shams Charania.
6h