
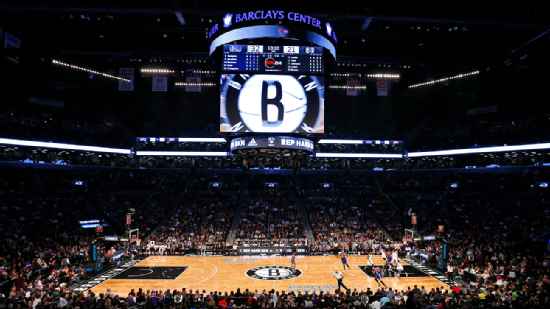
Minnesota Timberwolves @ Brooklyn Nets

2-1, 1-1 Away
107
2-1, 1-1 Away
Final
| 1 | 2 | 3 | 4 | T | |
|---|---|---|---|---|---|
MIN | 27 | 20 | 28 | 32 | 107 |
BKN | 31 | 31 | 24 | 10 | 96 |

1-1, 1-1 Home
96
1-1, 1-1 Home
Game Leaders


Team Stats


50% (44-88)
Field Goal %
48% (35-73)
35% (7-20)
Three Point %
57% (13-23)
80% (12-15)
Free Throw %
72% (13-18)
11
Turnovers
15
53
Rebounds
37
Game Information
Brooklyn, NY
Referee:Derek Richardson
Referee:Marc Davis
Referee:Bennie Adams
Team Stats
 | | |
|---|---|---|
| FG | 44-88 | 35-73 |
| Field Goal % | 50 | 48 |
| 3PT | 7-20 | 13-23 |
| Three Point % | 35 | 57 |
| FT | 12-15 | 13-18 |
| Free Throw % | 80 | 72 |
| Rebounds | 53 | 37 |
| Offensive Rebounds | 16 | 8 |
| Defensive Rebounds | 29 | 21 |
| Assists | 30 | 24 |
| Steals | 9 | 7 |
| Blocks | 7 | 4 |
| Total Turnovers | 11 | 15 |
| Points Conceded Off Turnovers | 22 | 12 |
| Fast Break Points | 9 | 7 |
| Points in Paint | 62 | 34 |
| Fouls | 18 | 17 |
| Technical Fouls | 0 | 0 |
| Flagrant Fouls | 0 | 0 |
Matchups
2025-26 Standings
Western Conference
| Northwest | W | L | PCT | GB | STRK |
|---|---|---|---|---|---|
| Oklahoma City | 64 | 18 | .780 | - | L2 |
| Denver | 54 | 28 | .659 | 10 | W12 |
| Minnesota | 49 | 33 | .598 | 15 | W2 |
| Portland | 42 | 40 | .512 | 22 | W2 |
| Utah | 22 | 60 | .268 | 42 | L1 |
Eastern Conference
| Atlantic | W | L | PCT | GB | STRK |
|---|---|---|---|---|---|
| Boston | 56 | 26 | .683 | - | W2 |
| New York | 53 | 29 | .646 | 3 | L1 |
| Toronto | 46 | 36 | .561 | 10 | W1 |
| Philadelphia | 45 | 37 | .549 | 11 | W2 |
| Brooklyn | 20 | 62 | .244 | 36 | L3 |
NBA News

Jersey worn by Jalen Brunson in G1 of NBA Finals sells for $1M-plus
A jersey worn by New York Knicks star point guard Jalen Brunson during Game 1 of the 2026 NBA Finals sold at Sotheby's for $1,024,000 after a 70-bid war Wednesday, a record paid for any Brunson collectible.
3h
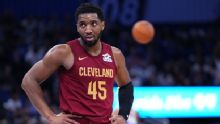
2026 NBA buzz: Latest free agency and trade updates
We're tracking deals, trades and buzz across the NBA, including Donovan Mitchell agreeing to an extension with the Cavs.
7h

Tim Hardaway Jr. excited to follow in his dad's footsteps
Tim Hardaway Jr. excited to follow in his dad's footsteps
8h